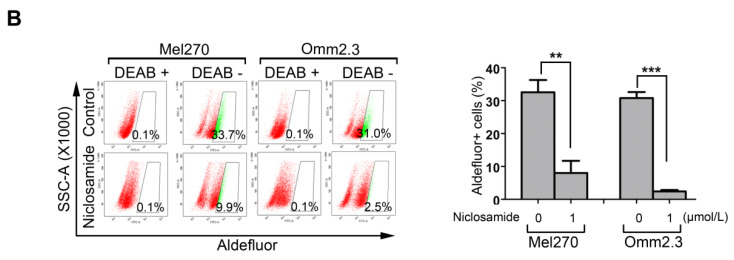
Figure 6B.
Mel270 and Omm2.3 cells were treated with niclosamide (1 μmol/L) for 48 h, and the percentage of Aldefluor+ cells was determined by flow cytometry. Representative flow cytometry data and bar graph with SD from 3 independent experiments are shown. **, p< 0.01; ***, p< 0.001, Student's t test.

