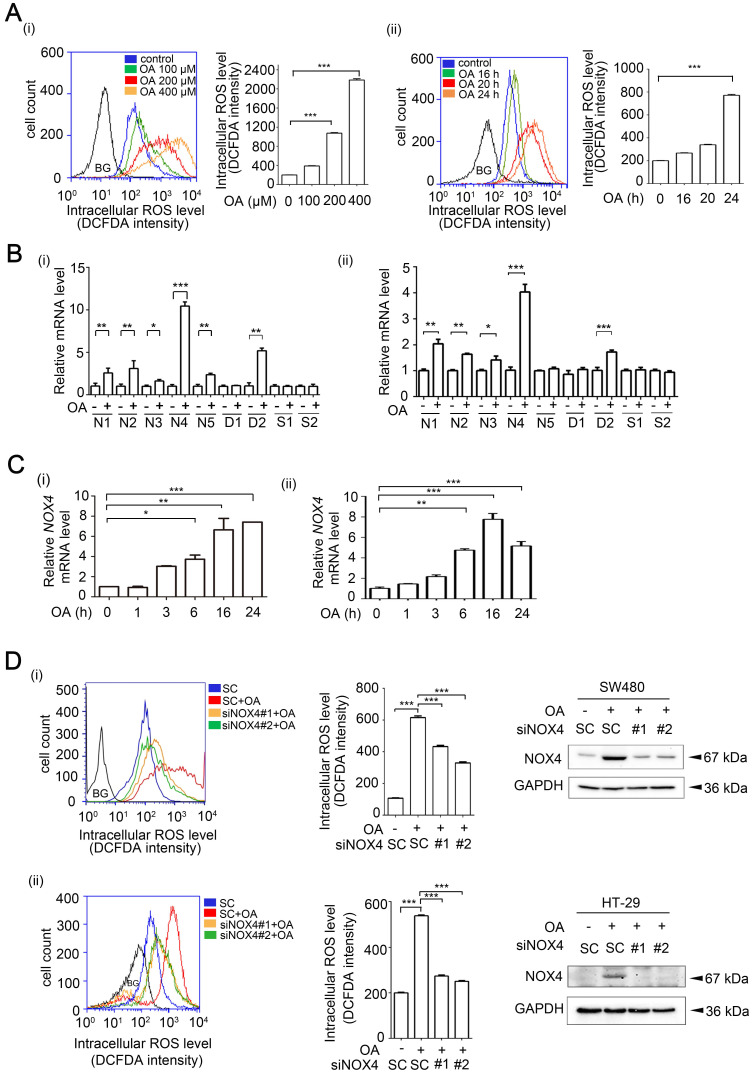
Figure 1.
OA-induced ROS production is dependent on NOX4 expression in CRC cells. (A) OA-induced ROS levels were examined by flow cytometry analysis with DCFDA staining in SW480 cells treated with OA for various concentrations (i) or periods of time (ii), as indicated. Quantification of ROS levels are shown in columns. BG indicates background. (B-C) Real-time quantitative PCR analysis was performed for detecting NOX1-5 (N1-5), SOD1-2 (S1-2), DUOX1-2 (D1-2) mRNA levels in SW480 (i) or HT-29 (ii) cells treated with 200 µM OA for 16 h (B) or the indicated period of time (C). (D) ROS levels and NOX4 protein expression were examined by flow cytometry analysis with DCFDA staining and western blotting, respectively. SW480 (i) and HT-29 (ii) cells were transfected with 20 nM scrambled oligonucleotides (SC) or NOX4 siRNA (siNOX4 #1 or #2) for 24 h and then treated with 200 µM OA for 24 h. BG indicates background. The data are presented as the mean ± SEM. P-values were determined using a two-tailed Student's t-test. *P < 0.05; **P < 0.01; ***P < 0.001 (n=3).

