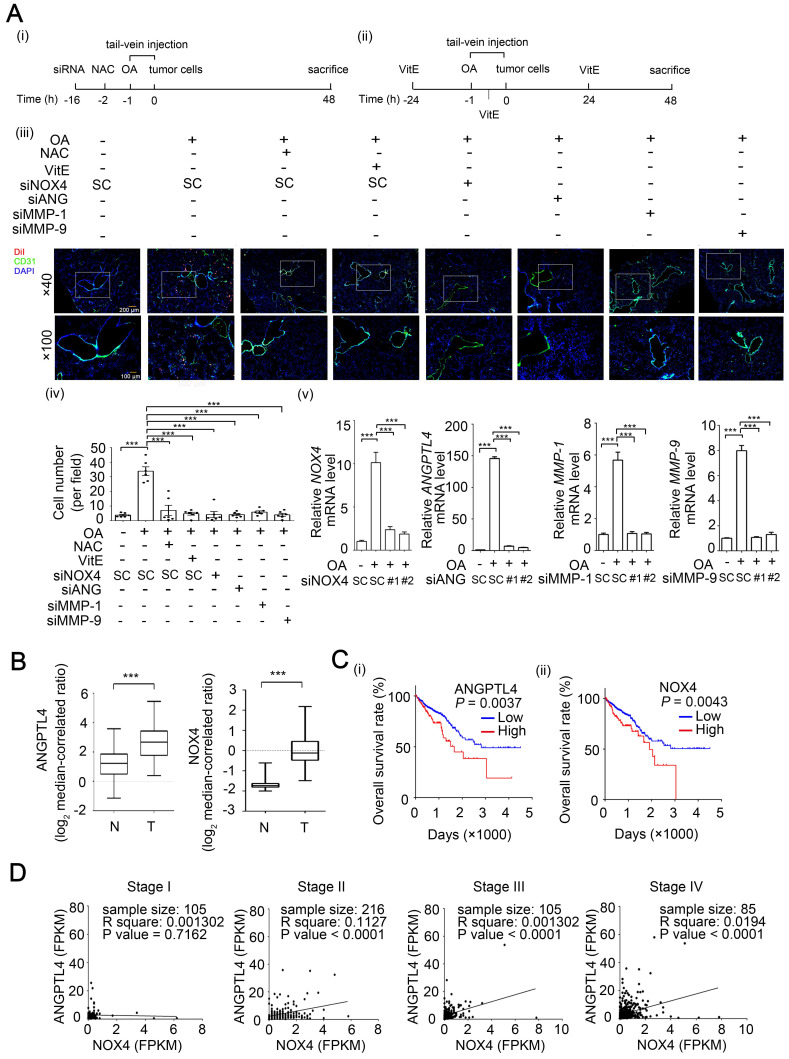
Figure 7.
The ANGPTL4/NOX4 axis is essential for OA-induced CRC extravasation and is associated with clinical outcome. (A) Tumor cells penetrate to pulmonary blood vessels that was determined by in vivo extravasation assay. DiI staining of SW480 cells were transfected with 20 nM siNOX4, siANGPTL4, siMMP-1, and siMMP-9 or treated with 5 mM NAC and then injected intravenously into the tail vein of 6-week-old SCID-NOD mice which were preinjected intravenously with OA at a final concentration of 200 µM (i). The gavage feeding of vitamin E (VitE; 100 mg/kg body weight) is scheduled as indicated (ii). At 48 h after injection of tumor cells, the mice were sacrificed for examining of metastatic tumor cells surrounding the lung tissue as described in 'Materials and Methods'. Tumor cell penetration was imaged using a microscope (iii). Original magnification, × 40 and × 100; DiI labeled tumor cells (red); CD31 labeled blood vessels (green); DAPI labeled nucleus (blue). The number of tumor cell extravasation was calculated by analyzing at least four sections and six fields (iv); Six mice were analyzed for each group. Real-time quantitative PCR analysis was performed to determine NOX4, ANGPTL4, MMP-1, and MMP-9 mRNA levels in SW480 cells treated with 200 µM OA for 48 h (v). Values are the mean ± SEM. ***P < 0.001, Student's t-test. (B) Box plots comparing the levels of ANGPTL4 and NOX4 mRNA in human CRC tissue (T) (n=65) and normal adjacent tissue (N) samples (n=65) were generated according to published data sets from Oncomine. ***P < 0.001, Student's t-test. Ref: Genes Chromosomes Cancer. 2010, 49:1024-34. (C) Kaplan-Meier curves showing CRC patient survival were retrieved from TCGA database. The median value was used to classify patients into high-expression or low-expression of ANGPTL4 (i) and NOX4 (ii). P values indicate the comparison between patients with high and low of ANGPTL4 or NOX4 expression. (D) Concurrent expression of ANGPTL4 and NOX4 in tumor tissues of CRC patients (n=597) in TCGA database was quantitated (Pearson's correlation coefficient is shown in the figures). FPKM: Fragments Per Kilobase of transcript per Million; Stages I~IV.

