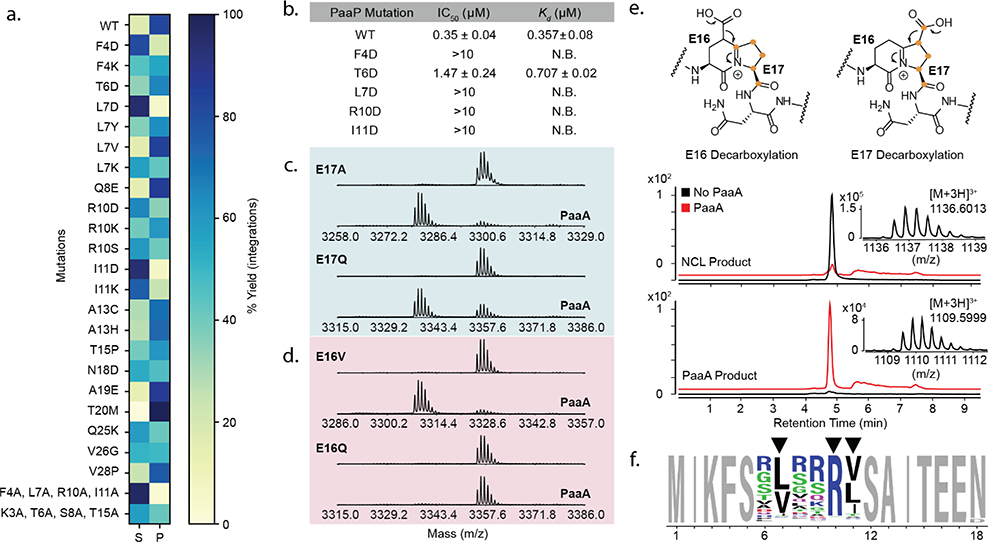
Figure 2. PaaA substrate promiscuity, binding, and processing.
(a) MALDI-TOF analysis of PaaA activity on PaaP mutants. Total extracted ion integration areas for substrate remaining “S” and observed products “P” were summated and used to calculate percent substrate or products for display in a heatmap. (b) PaaA binding to PaaP measured by competitive fluorescence polarization (FP, mean and error for n=3) and isothermal calorimetry (ITC, mean and error for n=2). (c, d) MALDI-TOF analysis of PaaA catalyzed dehydration (−18 Da) of PaaP core E mutants. (e) PaaP A13C was prepared by native chemical ligation with 13C-labeled E17. Orange dots indicate labeled carbons. Reaction of E17 labeled PaaP A13C with PaaA leads to a mass shift of 81 Da indicating loss of a single 13C atom due to E17 decarboxylation. (f) Weblogo analysis of 996 most enriched sequences with PaaP NNK 6.

