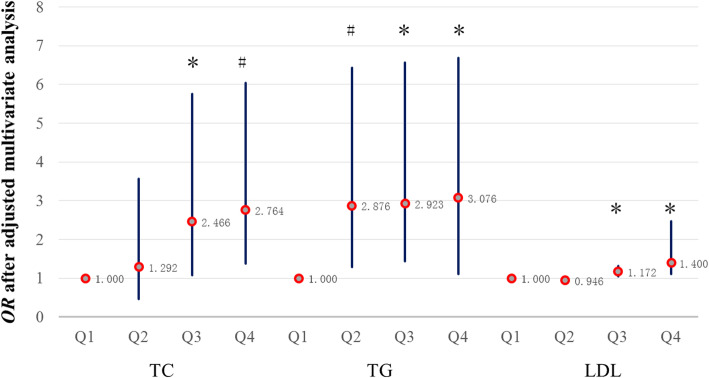
Fig. 3.
The relationship between blood lipid levels and OR after multivariable-adjusted analysis. A comparison of Q2–4 and Q1 in the same lipid group, respectively. Group TC: Data adjusted for age, gender, BMI, BP, TG, HDL, LDL, BUN, FPG, SCr, SUA, hypertension, diabetes, proteinuria. Group TG: Data adjusted for age, gender, BMI, BP, TC, HDL, LDL, BUN, FPG, SCr, SUA, hypertension, diabetes, proteinuria. Group LDL: Data adjusted for age, gender, BMI, BP, TC, TG, HDL, BUN, FPG, SCr, SUA, hypertension, diabetes, proteinuria. *P < 0.05, #P < 0.01

