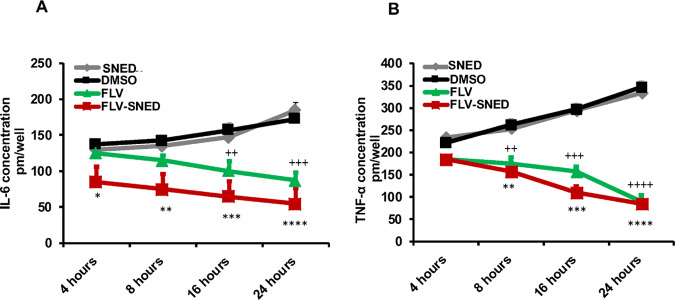
Figure 7.
Cytokine secretion in FLV- and FLV-SNED-treated cells: MCF-7 cells were treated with FLV, FLV-SNED, DMSO, or SNED at the indicated time points. Concentrations of IL-6 and TNF-α were measured in the culture media. Basal IL-6 levels were detected between 150 and 180 pM, in DMSO and SNED cells. Both FLV and FLV-SNED reduced IL-6 levels. ++P < 0.01 FLV vs DMSO at 16 h, +++P < 0.001 FLV vs DMSO at 24 h, *P < 0.05 FLV-SNED vs SNED at 4 h, **P < 0.01 FLV-SNED vs SNED at 8 h, ***P < 0.001 FLV-SNED vs SNED at 16 h, ****P < 0.0001 FLV-SNED vs SNED at 24 h. Two experiments performed in duplicate (A). Basal TNF-α levels were detected between 250 and 350 pM in DMSO- and SNED-treated cells. Both FLV and FLV-SNED reduced TNF-α levels. ++P < 0.01 FLV vs DMSO at 8 h, +++P < 0.001 FLV vs DMSO at 16 h, ++++P < 0.0001 FLV vs DMSO at 24 h, **P < 0.01 FLV-SNED vs SNED at 8 h, ***P < 0.001 FLV-SNED vs SNED at 16 h, ****P < 0.0001 FLV-SNED vs SNED at 24 h. Two experiments performed in duplicate (B).

