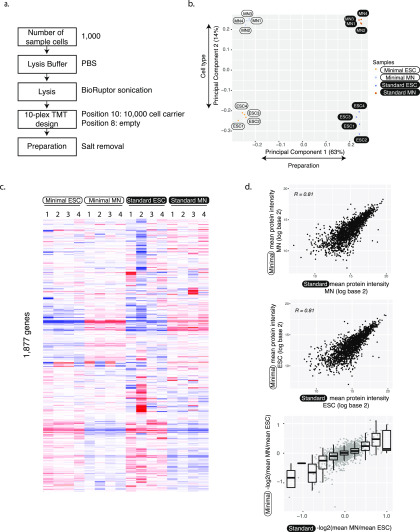
Figure 2.
Accurate and reproducible protein abundance measurements. (a) Flowchart illustrates the minimal input protocol with points of optimization. (b) First principal components of minimal and standard sample input data separate both the protocol but also the two different cell types. The analysis was done using 1763 protein groups that were identified in both minimal and standard preparations. (c) Heat map of protein abundances. Abundances were first scaled to the sum of log base 10 equaling 10 000 in each column. Then, we removed the first principal component and subtracted the row median from each entry to remove the gene-to-gene effect. Note that these normalizations were only used for visualization, not for significance testing for differential expression. We used hierarchical clustering with the Manhattan distance measure. Each experiment has four replicates. (d) Protein abundances (top, middle) and fold changes (bottom) from minimal and standard sample input preparations correlate well. The analysis was done using 1763 protein groups that were identified in both minimal and standard preparations. ESC—embryonic stem cell; MN—motor neuron.

