
Figure 4. Differential Expression of Transcriptomic and Proteomic Profiles between ccRCC Tumors and NAT Protein Expression.
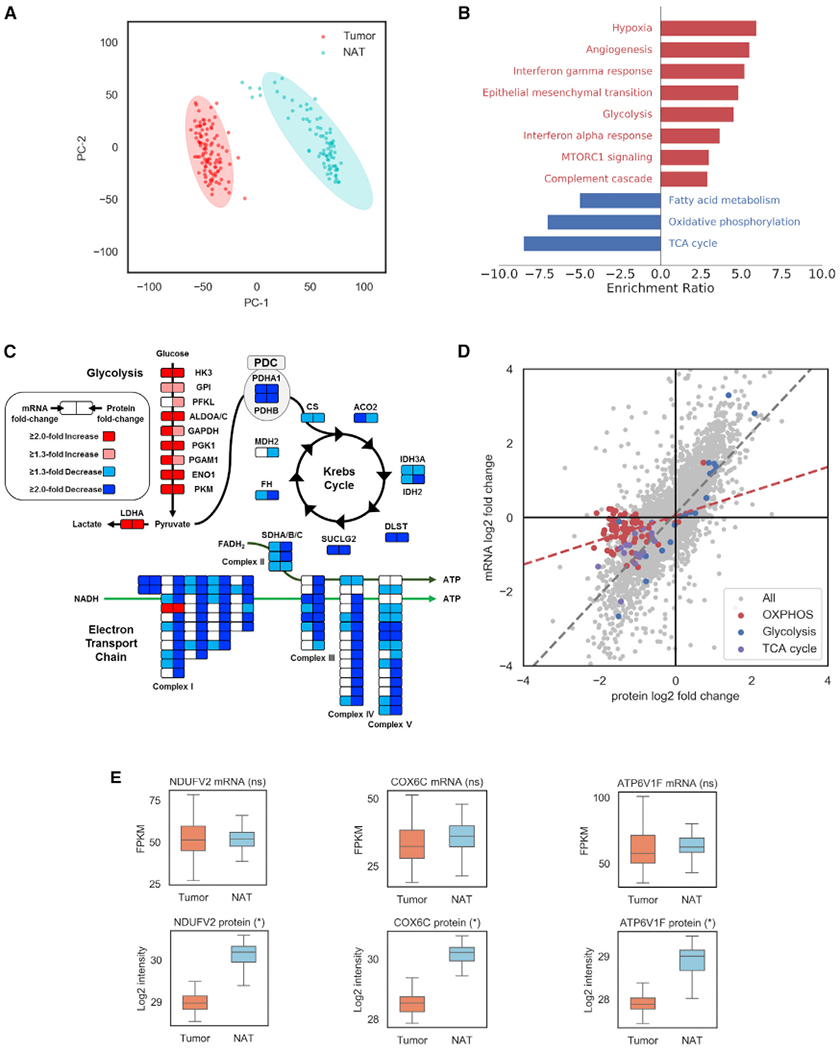
(A) PCA visualization of protein expression in ccRCC tumors and NATs.
(B) Analysis of significantly differentially regulated pathways (adjusted p < 0.05) between ccRCC tumors and NATs.
(C) Schema of metabolic pathways (glycolysis and electron transport chain [OXPHOS]) with select differential gene expression of mRNA and protein levels between ccRCC tumors and NATs.
(D) Scatterplots depicting expression of mRNA (x axis) and protein (y axis). Linear regression of all mRNA-protein pairs (gray dotted line) and OXPHOS mRNA-gene pairs (red dotted line) are shown. Metabolism-related genes are indicated.
(E) Boxplot of representative OXPHOS genes from complex I (NDUFV2), IV (COX6C), and V (ATP6V1F) displaying discordant mRNA-protein expression (n.s., not significant, *adjusted p < 0.05).