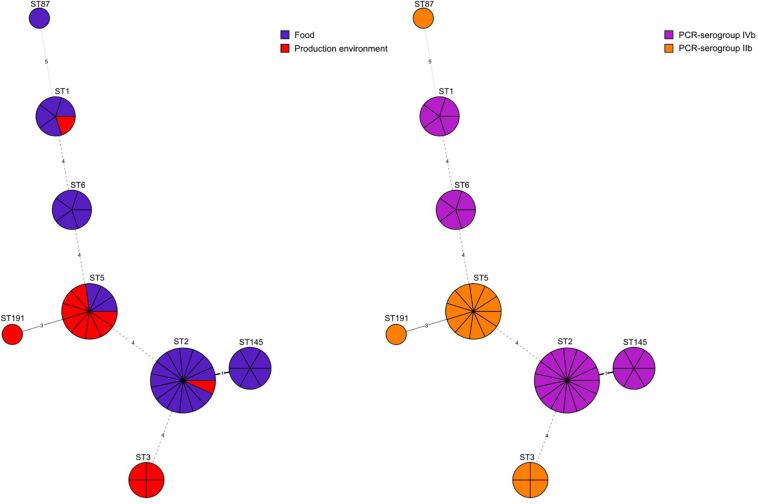
FIGURE 1.
Minimum spanning tree analysis based on MLST allelic profiles of 48 L. monocytogenes isolates. Each circle represents a sequence type (ST). The numbers on the connecting lines illustrate the numbers of target genes with different alleles. The sources of isolates and their serogroups are distinguished by the colors.

