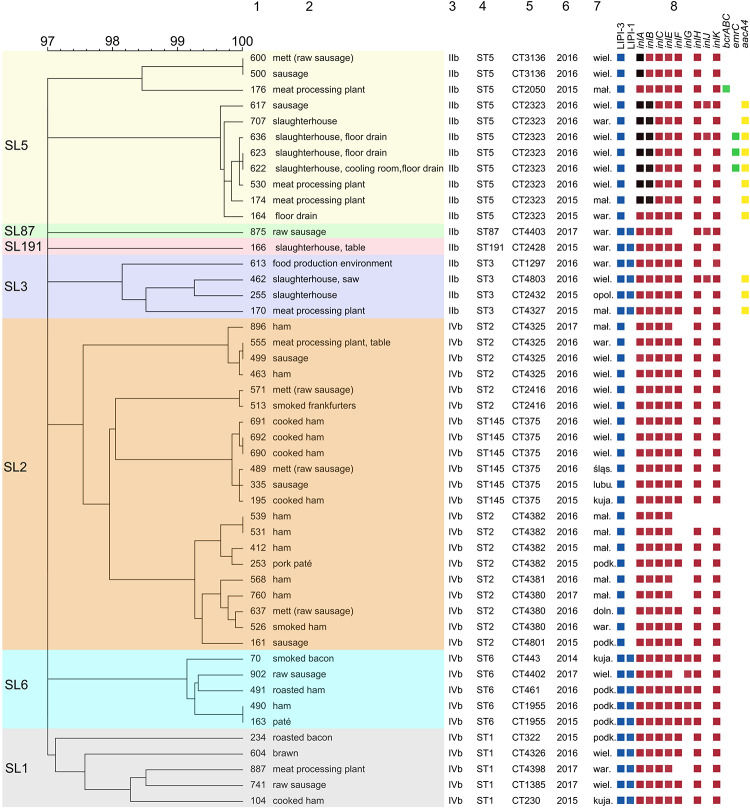
FIGURE 2.
Dendrogram representing clustering of L. monocytogenes PCR-serogroups IIb and IVb by cgMLST using single linkage clustering method. Degeneracy cut off value were 97% of similarity. Column: 1 – strain ID, 2 – source, 3 – PCR-serogroup, 4 – ST type, 5 – cgMLST type, 6 – year of isolation, 7 – place of isolation, 8 – detected genes. Color squares show presence of Listeria Pathogenicity Islands 1 and 2 (blue), internalins (orange), benzalkonium chloride resistance (green) and aminoglycosides resistance genes (yellow), respectively. Black squares indicate the presence of genes with truncation. Full metadata information are available in Supplementary Table S1. F, food, FPE, food production environment.

