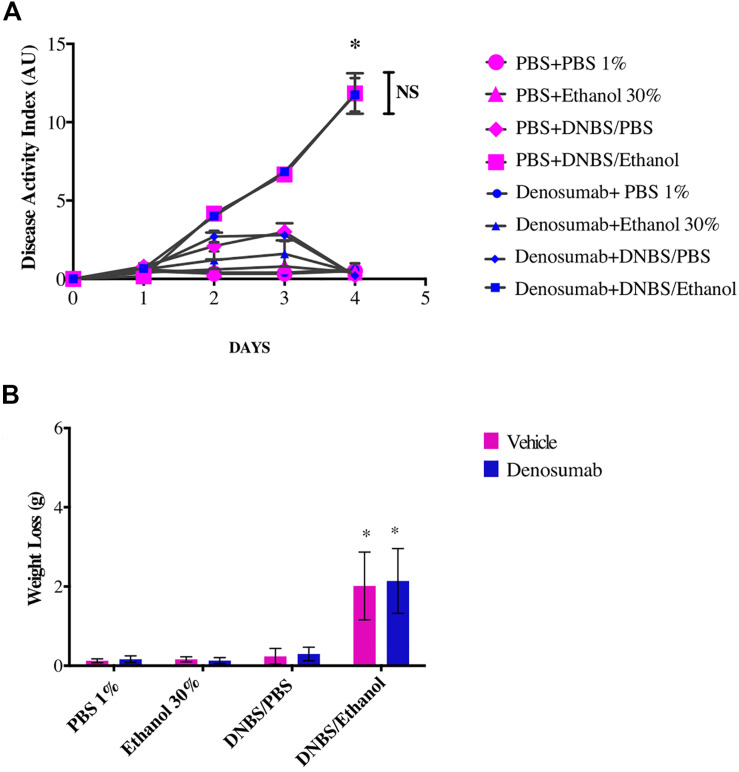
FIGURE 2.
The effects of DNBS/Ethanol-induced colitis and denosumab treatment on (A). Disease activity index, and (B). Weight loss. Vehicle = PBS 1%. Error bars are shown as SEM. *p < 0.001 when compared with other induction models within the denosumab or vehicle group calculated using SAS MIXED procedure and illustrated by Prism using two-way ANOVA. NS: no significant difference between denosumab treatment and DNBS/Ethanol-induced colitis. n = 6 mice per group. AU: arbitrary unit.

