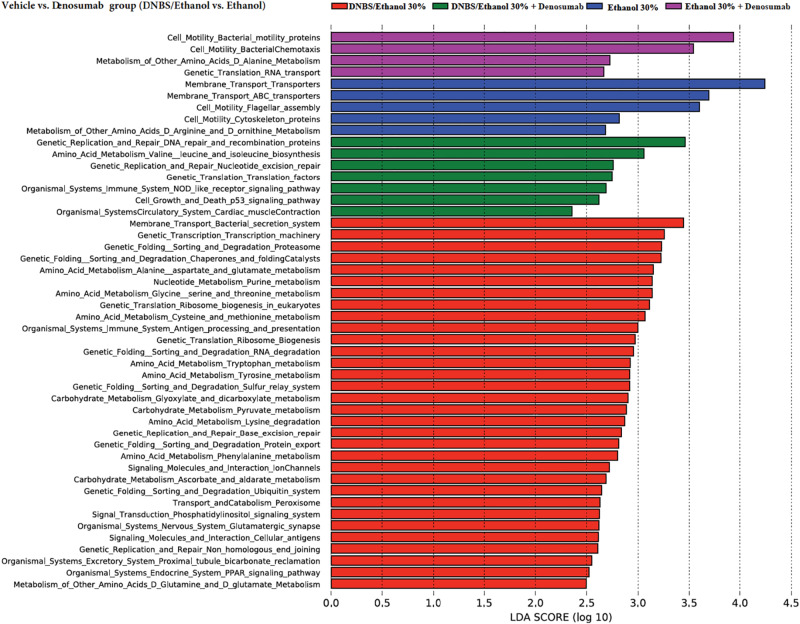
FIGURE 9.
Prediction of functional capacity of colon-associated microbiota in vehicle vs. denosumab-treated mice. A statistical difference between KEGG pathways (explored at Levels 1–3, indicated as L1–L3) of predicted colonic mucosa metagenomes were evaluated by LEfSe, a metagenome analysis approach which performed the linear discriminant analysis following the Wilcoxon Mann–Whitney test to assess effect size of each differentially abundant variable. The length of the horizontal bars indicated log-fold changes for each variable. Color code represents the class of treatments; red and green represent colitic condition of DNBS/Ethanol, while blue and purple are showing the Ethanol 30% condition in the absence and presence of denosumab, respectively.

