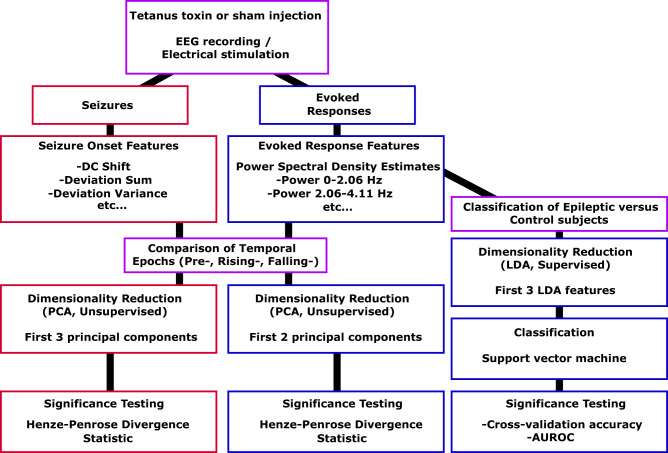
Figure 2.
Data pipeline diagram. All animals received an injection of either tetanus toxin or saline, then began EEG recording with the intermittent stimulation. EEG recordings from each animal contained data both from seizures (in the Experimental group) and from evoked responses (in both groups), which were analysed separately. Independent features are computed on seizures and evoked responses. For investigating changes within animals, dimensionality reduction is performed using unsupervised learning that maximizes the variance. We used divergence measures to test how separable the different groups were (e.g. Pre-seizure versus Rising-seizure versus Falling-seizure phases, early versus late seizures). For investigating changes between Experimental and Control evoked responses, supervised learning was used for dimensionality reduction. Classification accuracy was measured using both cross-validation and AUROC metrics. AUROC = area under the ROC curve; LDA = linear discriminant analysis; PCA = principal component analysis.

