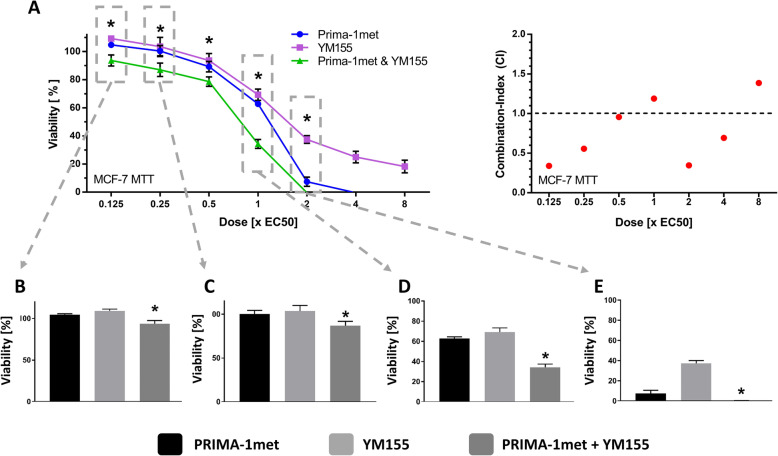
Fig. 5.
Synergy interpretation. HT-29 and MCF-7 cells were seeded into a 96 well plate at a density of 1.5 (HT-29) and 0.5 × 10⁴/well (MCF-7), incubated 24 h to a confluency of 50%, then medicated with increasing concentrations of PRIMA-1met, YM155 and their combination for 48 h. Cell viability was assessed using the MTT-Assay and curve was further analysed using Graphpad Prism. CI-Values were calculated by CompuSyn and illustrated with red dots in the diagram on the right. Each dot corresponds to the respective combination shown in the graph to the left. CI-values underneath the dashed line (< 1) imply a synergism. Viability data were also illustrated in a bar-chart design at 0.125x (B) 0.25x (C), 1x (D) and 2x EC50 (E)

