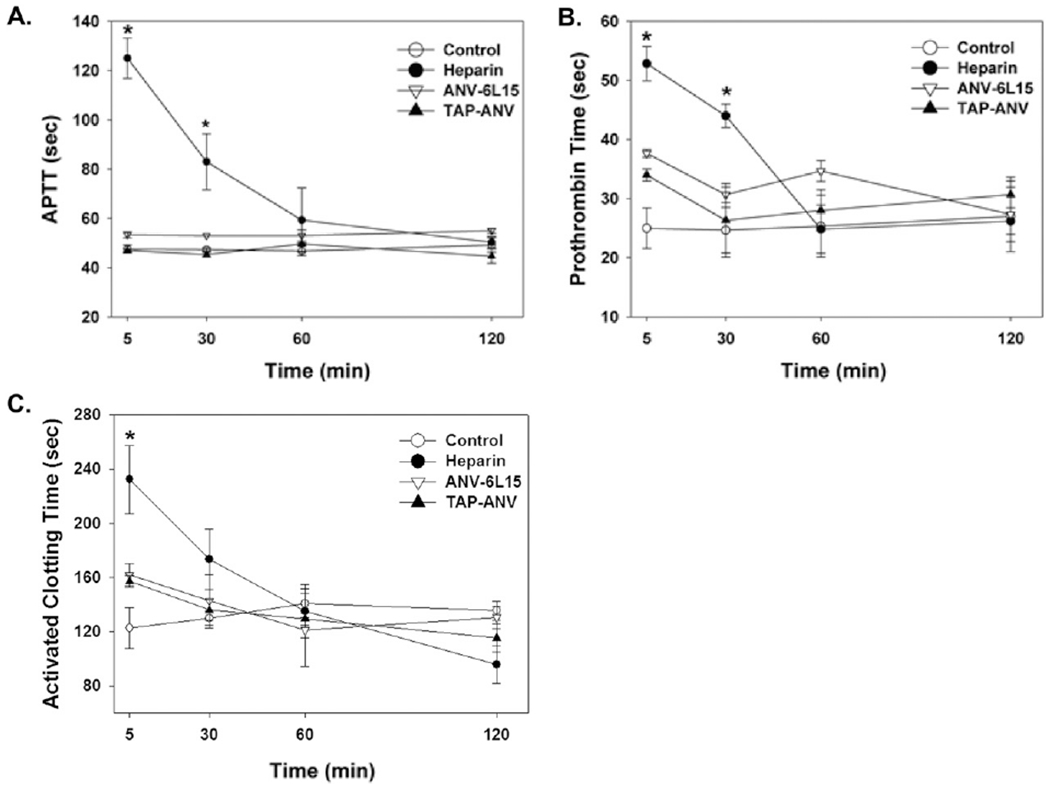
Fig. 2.

Activated Clotting Time (ACT), Activated Partial Thromboplastin Time (aPTT) and Prothrombin Time (PT). Blood samples were collected from the tail veins of rats at 5,30,60, and 120 min after bolus injection of PBS (control), heparin (100 U/kg), ANV-6L15 (50 μg/kg), or TAP-ANV (50 μg/kg). Plasma (A) APTT, (B) Prothrombin Time and whole blood (C) ACT were measured and expressed as mean ± SEM (n = 6). The symbol, * indicated statistically significant difference compared with control group (P < 0.05).
