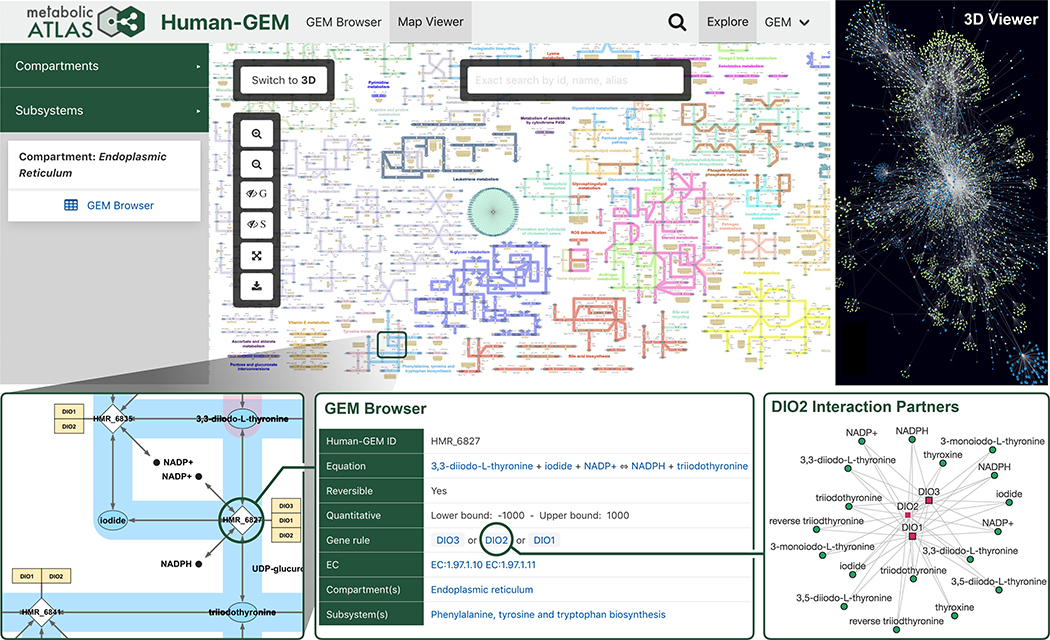
Fig. 2. Highlighted features provided by the Metabolic Atlas web portal.
A collection of screen captures from Metabolic Atlas, illustrating key features such as 2D and 3D metabolic network maps. A zoomed inset shows a subset of the endoplasmic reticulum compartment map, from which further information on components such as reactions, enzymes, or metabolites can be accessed in the GEM Browser. Interaction partner graphs are dynamically generated for any given enzyme or metabolite in Human1, which show the connectivity to other metabolites and enzymes based on their associated reactions.

