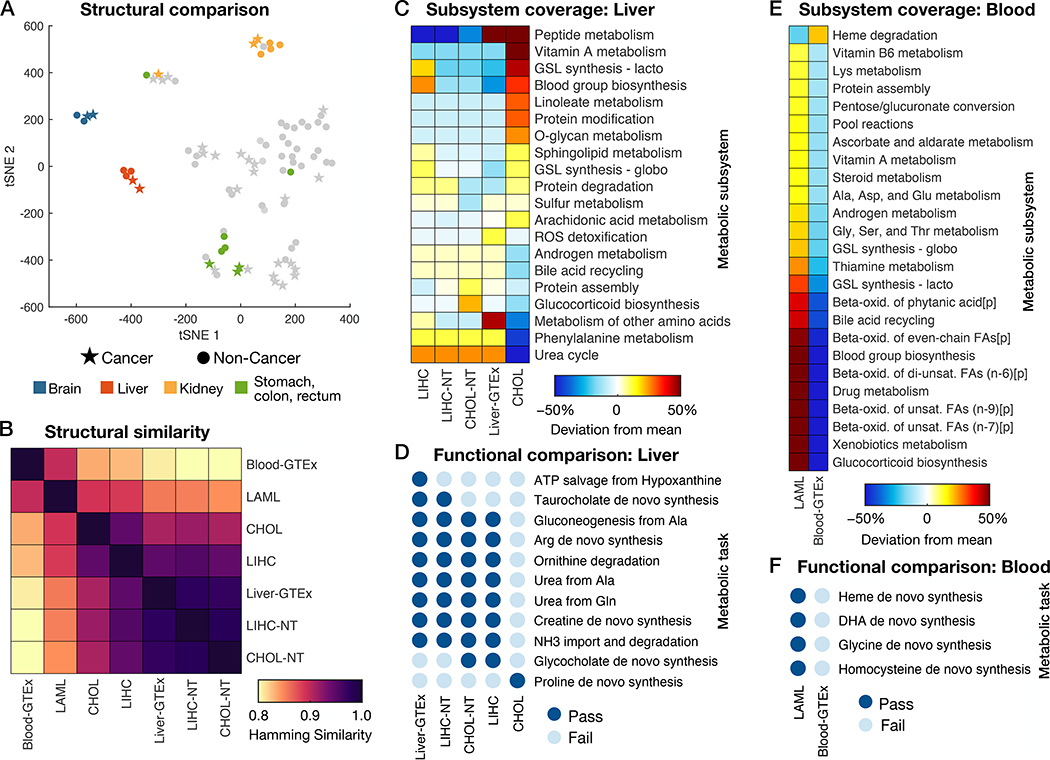
Fig. 3. Structural and functional comparison of cancer- and healthy tissue-specific GEMs.
(A) Visualization of differences in models’ reaction content using a tSNE projection to two dimensions based on the Hamming similarity. See Fig. S5 for individual point labels. (B) Heatmap showing pairwise comparisons of reaction content between GEMs specific to healthy liver (CHOL-NT, LIHC-NT, and Liver-GTEx), blood, and their corresponding cancers (CHOL, LIHC, and LAML). (C) Relative subsystem coverage (number of reactions present in a model that are associated with the given subsystem) compared among GEMs of liver and liver tumors. Only subsystems with at least a 10% deviation from mean subsystem coverage among the models are shown. (D) Summary of metabolic task performance by the healthy and cancerous liver models, showing only the tasks that differed in at least one of the models. (E) Comparison of relative subsystem coverage between LAML- and blood-specific GEMs, showing only subsystems with at least a 10% deviation between the two models. (F) A summary of the five metabolic tasks that could be completed by the LAML GEM but failed in the healthy blood GEM. ROS, reactive oxygen species; GSL, glycosphingolipid; FA, fatty acid; [p], peroxisomal compartment; DHA, docosahexaenoic acid.

