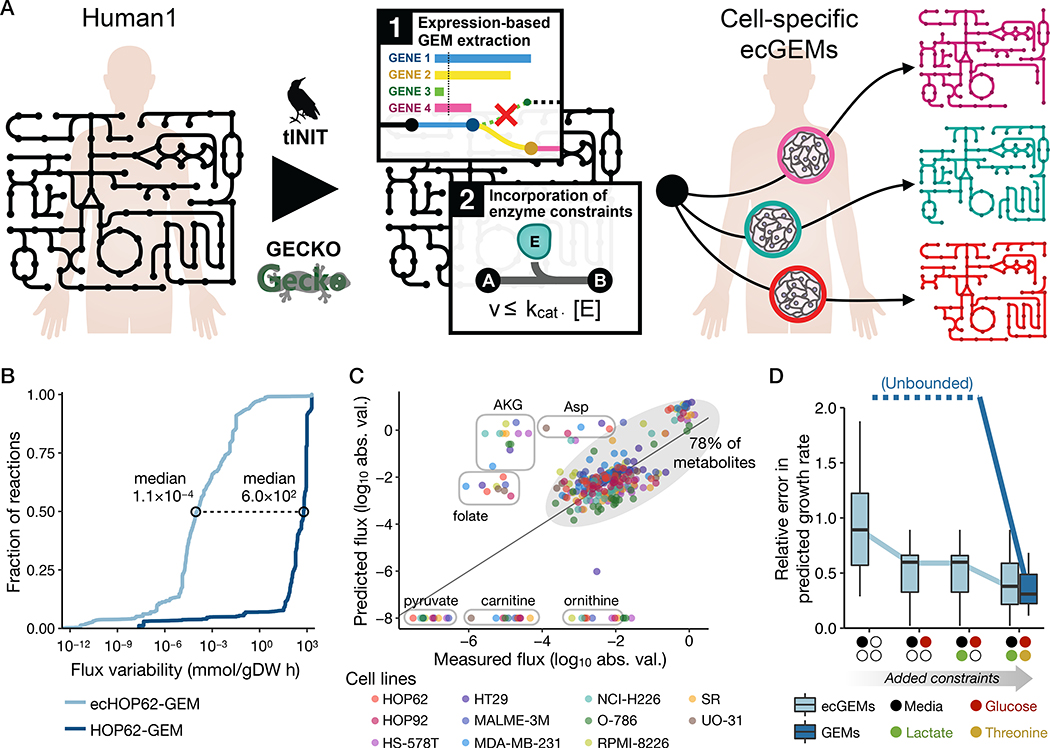
Fig. 5. Generation and analysis of human ecGEMs.
(A) Graphical representation of the pipeline used to construct NCI-60 cell-line specific ecGEMs from Human1. (B) Cumulative distribution of flux variability among reactions in HOP62-GEM and ecHOP62-GEM. Only the ~3,200 reactions that carried a flux of >10−8 mmol/gDW h when optimizing biomass production in HOP62-GEM were included in the plot. Distributions for all 11 cell lines are shown in Fig. S12. (C) Comparison of predicted with measured exchange fluxes (log10-transformed absolute flux values) for the 11 cell-specific ecGEMs, where only the set of metabolites present in the growth medium (Ham’s medium) was specified. Different colored markers represent the different cell lines. Metabolites whose fluxes were systematically under- or over-predicted among the different models are labeled in circles, whereas the other ~78% lie within the shaded oval. Note that metabolites along the bottom of the plot have a predicted flux of zero but are shown here as having the absolute minimum measured value to avoid logarithm of zero. (D) Boxplots showing the relative error in predicted growth rate for the 11 cell-specific ecGEMs and non-ecGEMs. “Unbounded” indicates that the solutions are effectively unbounded and therefore have unquantifiable (infinite) error. Colored markers on the x-axis denote the exchange constraints that were cumulatively added to the models when making predictions. “Media” indicates that only the metabolites present in the growth medium were specified, without constraining their exchange rates. “Glucose”, “Lactate”, and “Threonine” indicate that the exchange flux for those metabolites in the model were constrained to the measured value.

