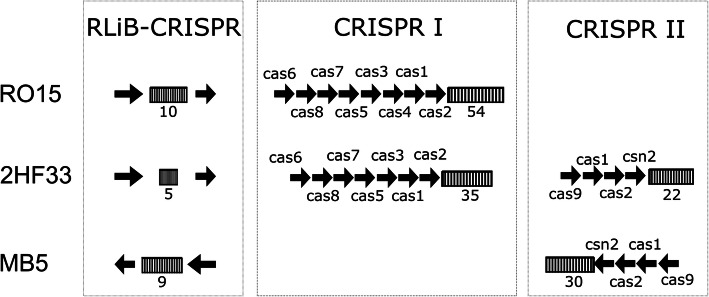
Fig. 4.
Visualization of CRISPR systems in strains RO15, 2HF33, and MB5. The figure shows a representation of CRISPR systems in strains RO15, 2HF33, and MB5. These three strains contained more than one CRISPR system, while the rest of the selected strains in the study contained only the RliB-CRISPR system. Arrows represent genes, rectangles represent repeat/spacer arrays, the numbers below the rectangles indicate the number of spacers in the array. For simplification, sizes of the arrows do not correspond to the actual size of the genes

