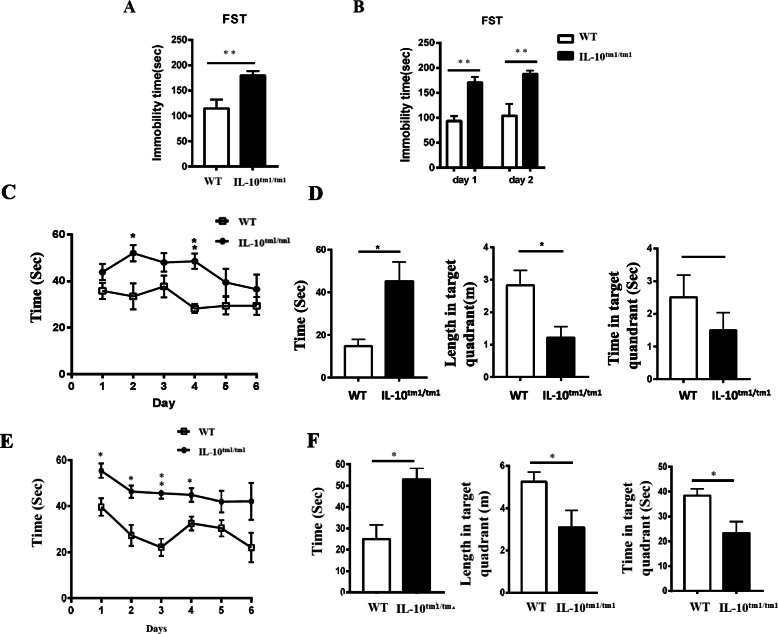
Fig. 5.
IL-10tm1/tm1 mice exhibited depressive-like behavior and learning and memory deficits. a Representative graph showing the duration of immobility during the FST without LPS treatment. b Representative graph showing the duration of immobility during the FST recorded 24 h and 48 h following administration of LPS. MWMT performed over 6 days, including 5 days training and the 1-day test. The graphic shows the time (seconds) needed for each group of mice without (c) or with (e) LPS administration to localize a submerged platform in the swimming area. Representative graphs show escape latency (left), path length (middle), and time (right) spending in the target quadrant on the test day for each group of mice without (d) or with (f) LPS administration. *p < 0.05 and **p < 0.01

