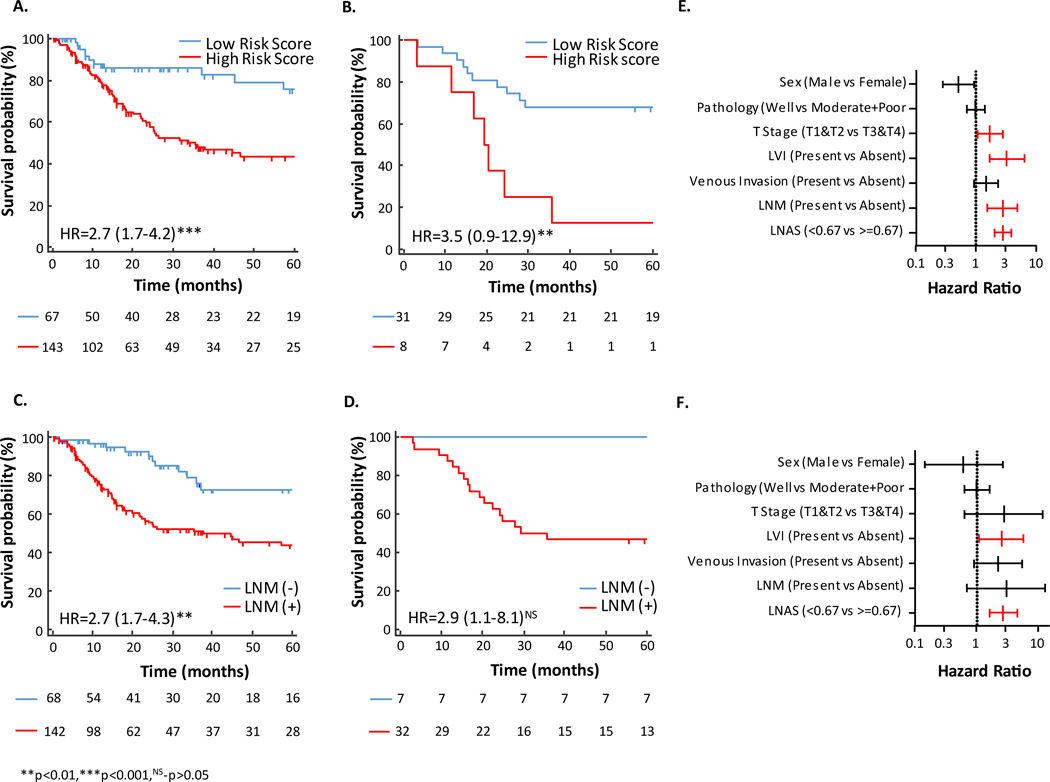
Figure 3: Kaplan Meier survival and Cox hazard ratio analysis of LNAS.
A) Kaplan Meier plot for 5 years OS (OS) associated with LNAS in training cohort. B) Kaplan Meier plot for 5 years OS associated with LNAS in validation cohort. C) Kaplan Meier plot for 5 years OS associated with lymph node metastasis in training cohort. D) Kaplan Meier plot for 5 years OS associated with lymph node metastasis in validation cohort. E) Forrest plot with hazard ratio of clinical variables and LNAS in training cohort. F) Forrest plot with hazard ratio of clinical variables and LNAS in validation cohort. Red bar indicate significantly higher hazard ratio. LVI-lymphatic vessel invasion, LNM-lymph node metastasis.

