Fig. 1.
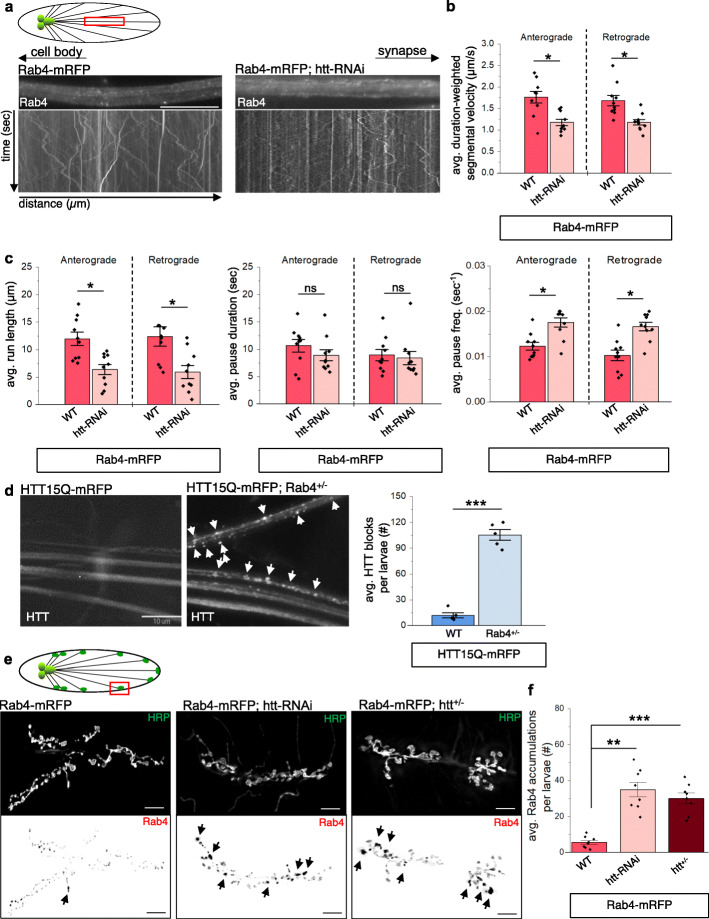
Reduction of htt disrupts the axonal motility of Rab4-vesicles. a Schematic diagram of larval nervous system showing the brain and segmental nerves. Red box = imaged area (90 μm). Arrows depict location of the cell bodies and synapses. Representative images from movies and corresponding kymographs from larvae expressing Rab4-mRFP or Rab4-mRFP with 70% reduction of htt (htt-RNAi). X axis = distance (μm), Y axis = time (s). Bar = 10 μm. b Quantification of duration-weighted segmental velocity (μm/s) indicate significant decreases in both anterograde (p < 0.01) and retrograde (p < 0.01) Rab4-mRFP vesicle velocities with 70% reduction of htt. n = 10, > 500 vesicles. c Quantification analysis shows that Rab4-vesicle run lengths (μm) are significantly decreased (p < 0.01), that Rab4-vesicle pause frequencies (sec− 1) are significantly increased (p < 0.01), but that Rab4-vesicle pause durations (sec) are not changed (ns) with 70% reduction of htt compared to Rab4-mRFP expressing larvae (WT). n = 10, > 500 vesicles. d Representative images of larval segmental nerves expressing HTT15Q-mRFP or HTT15Q-mRFP with Rab4+/− (Rab4MI10530/+). Quantification of axonal blocks (#) reveal a significant increase (p < 0.0001) in axonal accumulations of HTT15Q-mRFP with a 50% genetic reduction of Rab4. n = 5. Bar = 10um. e Schematic diagram of third instar larval nervous system showing brain, segmental nerves, and neuromuscular junctions (NMJs). Representative images of Rab4-mRFP expressing larvae stained with HRP-FITC showing NMJs within muscle 6/7 segment A4–5 of third instar larvae from htt-RNAi (70% reduction) and htt+/− (50% reduction). Top panels = HRP-FITC staining. Bottom Panel = inverted image of Rab4-mRFP fluorescence. Bar = 5 μm. f Quantification of the number (#) of Rab4 accumulations greater than 2μm2 (the average size of boutons in WT, black arrow heads) show significant increases in Rab4-mRFP accumulations with 70% (p < 0.001) or 50% (p < 0.0001) htt reduction. n = 8. Statistical analysis was determined using the two-sample two-tailed Student’s t-test. ns = p > 0.01, *p < 0.01, **p < 0.001, ***p < 0.0001

