Fig. 5.
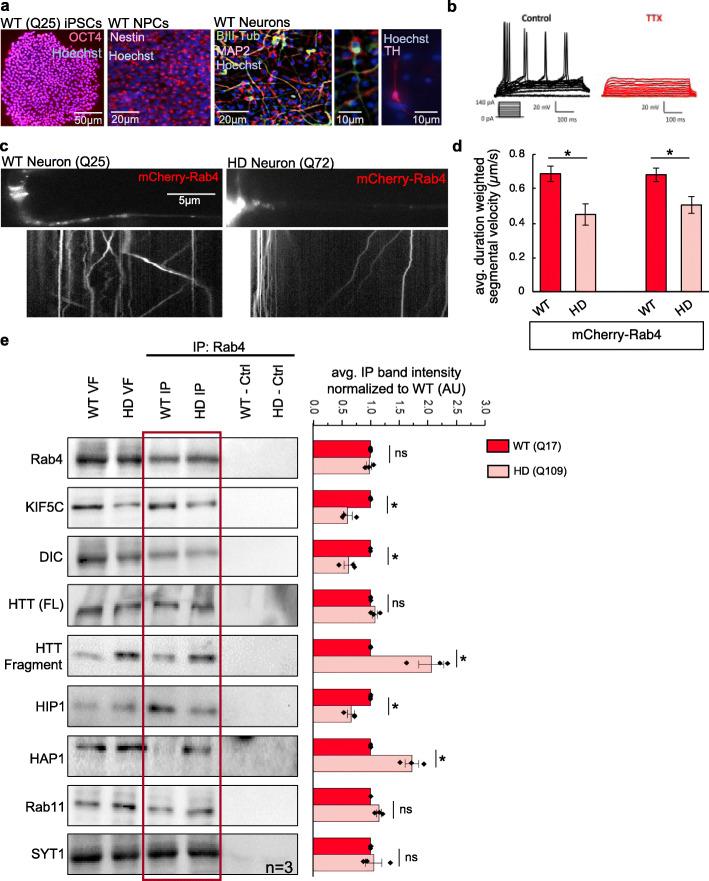
The axonal motility of Rab4 is disrupted in human HD iNeurons. a Representative images from normal (WT, Q25) human iPSCs stained with the pluripotent marker OCT4, the neuronal precursor (NPC) marker Nestin and the mature neuronal markers MAP2 and βIII-Tubulin. Hoechst stains nuclei. Differentiated neurons show Tyrosine hydroxylase (TH) positive staining. Bar = 50, 20, or 10 μm. b Electrophysiological analysis of normal human neurons differentiated from iPSCs show action potentials which are abolished in the presence of TTX. c Representative movies with the corresponding kymographs from normal (WT, Q25) and HD (Q72) neurons transfected with mCherry-Rab4. Bi-directional Rab4 motility is observed in WT neurons. HD neurons show few moving mCherry-Rab4 puncta. d Quantification of duration weighted-segmental velocity (μm/s) revealed that both the anterograde and retrograde global velocities of mCherry-Rab4 puncta are significantly decreased (p < 0.01, p < 0.01) in HD neurons compared to WT neurons. n = 7 independent neurites per genotype from 2 cultures. ns = p > 0.01, *p < 0.01. Statistical significance was determined using the non-parametric Wilcoxon–Mann–Whitney rank sum test. e Representative western blot of a Rab4-containing VF IP from WT (Q17) or HD (Q109) neurons that was probed for Rab4, KIF5C, DIC, HTT, HIP1, HAP1, Rab11, and SYT1. The HTT fragment, HAP1, and Rab11 bands appear darker in HD IP compared to WT IP fraction. Conversely, the HIP1, KIF5C and DIC bands appear lighter in the HD IP compared to WT IP fraction. No bands are seen in the negative no antibody control (−Ctrl). Band intensity ratios of the IP fraction were analyzed for each probe from WT and HD neurons and normalized to the WT IP band intensity for that probe (AU). When comparing WT to HD, band intensity ratios showed a significant decreased for KIF5C (p < 0.05), DIC (p < 0.05), and HIP1 (p < 0.05), while significant increases were seen for the HTT fragment (p < 0.05) and HAP1 (p < 0.05). n = 3. ns = p > 0.05, *p < 0.05. Statistical significance was determined using the two-sample two-tailed Student’s t-test

