
Figure 2.
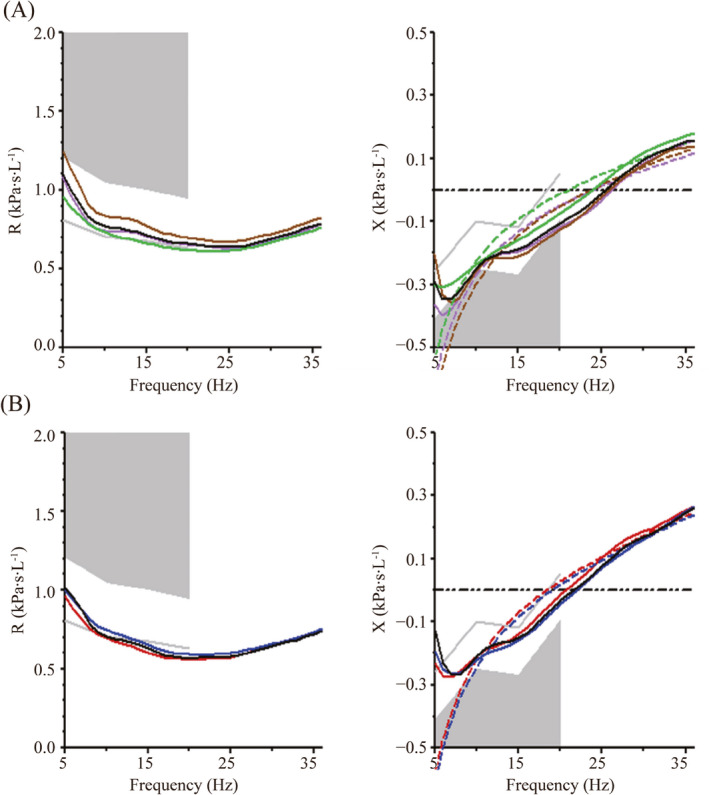
Impulse oscillometry tracings from patient on admission (A) and discharge (B). Resistance (R) is on the left panel, reactance (X) is on the right panel. In both panels, colored lines represent different trials (limited to 3 for simplicity) and the black solid line is the mean of all trials. Note that in the reactance panel, the respiratory system reactance (Xrs) consistently curves upward at low frequencies (< about 7 Hz) (“reactance inversion.”). This was observed both on admission (A) and on discharge (B). The dashed lines represent the theoretical exponentially greater reactance at low frequencies if reactance inversion were not present (see text)