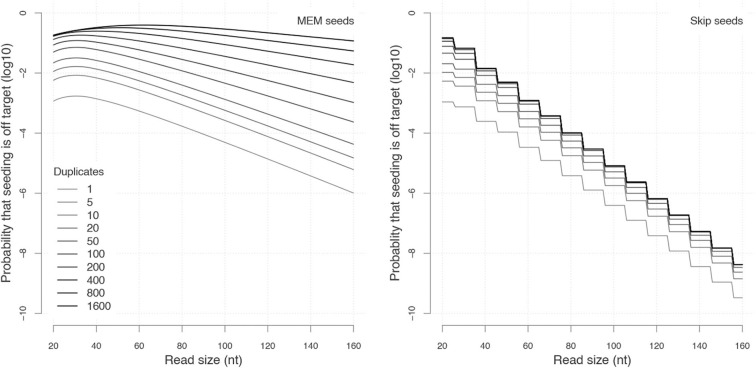
Figure 15.
Comparing seeding strategies with Sesame. (Left) MEM seeds with γ = 19 and μ = 0.06. (Right) Skip-9 seeds with γ = 16 and μ = 0.06. The probabilities that seeding is off-target were computed using Sesame. Each curve represents the probability for a given number of duplicates (N). Estimates using iterative methods (MEM seeds where N ≤ 20) were computed to within 1% accuracy. Estimates using Monte Carlo sampling (MEM seeds where N > 20) were computed as the average of 500 million simulations.

