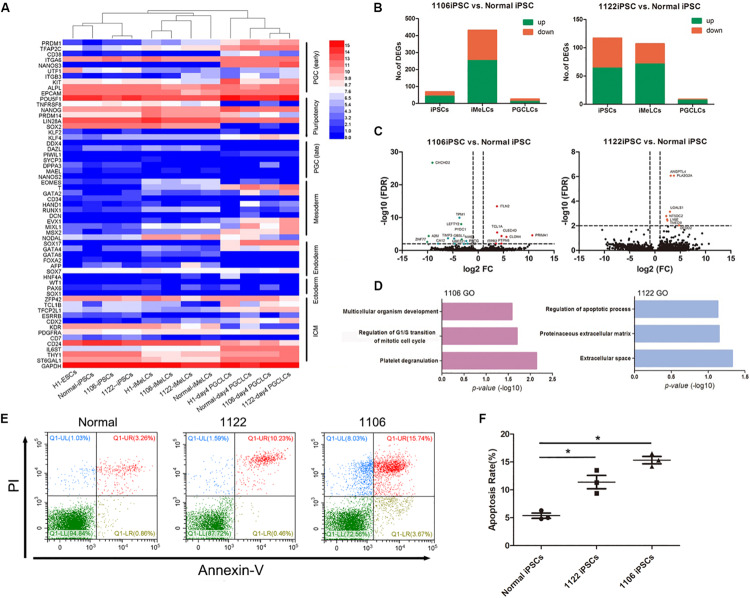
FIGURE 5.
Differentially expressed gene analysis between PGCLCs derived from NOA and normal hiPSCs. (A) Heat map of gene expression of key PGC-associated genes (early and late stage) and of pluripotency, mesoderm, endoderm, ectoderm, and ICM genes. (B) Numbers of genes upregulated or downregulated at key stages during PGCLC specification of NOA 1106 iPSCs (left) and NOA 1122 iPSCs (right) compared with that of normal iPSCs. (C) Volcano plot of the DEGs in PGCLCs derived from NOA 1106 iPSCs (left) and NOA 1122 iPSCs (right) compared with PGCLCs derived from normal iPSCs. The red dots indicate genes upregulated, and the green dots indicate genes downregulated. (D) Enriched GO terms in the upregulated genes of PGCLCs derived from NOA 1106 iPSCs (left) and NOA 1122 iPSCs (right) compared with PGCLCs derived from normal iPSCs. Primordial germ cell–like cells, the EpCAM, and INTEGRINα6 double-positive cells in day 4 embryoids. (E) Fluorescence-activated cell sorting analysis by annexin V and PI staining for day 4 embryoids differentiated from NOA iPSCs and normal hiPSCs. The percentages of cells in the four quadrants are shown. (F) Apoptotic rates of day 4 embryoids differentiated from NOA iPSCs and normal hiPSCs. Error bars indicate mean ± SD of three independent experiments. Comparisons were conducted using ANOVA. Asterisk indicated statistically significant differences (P < 0.05) between the NOA iPSCs and the normal iPSCs.

