Figure 2.
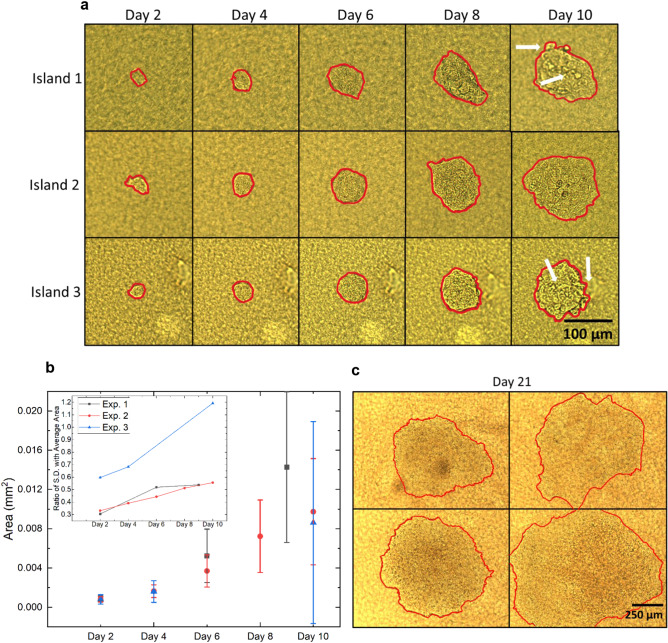
Island tracking over time reveals variable increases in tumor size. Single MCF7 cells were cultured on collagen I islands, as described in Fig. 1 and resulting tumors were manually outlined (as shown in red) to measure their areas with Image J. a Bright-field images of three tumors (Islands 1, 2, 3) over time. Grape-like features on the tumor top and at the periphery are indicated by white arrows. b Temporal evolution of tumor area over 10 days for three biological replicates. Each solid dot represents the average area of 26 (in black), 48 (in red) and 47 (in blue) tumors with standard deviation. Inset shows the increasing trend in ratio of standard deviation to the average of tumor area for each experiment over time. c Images of tumors from another experiment that were maintained in culture for 21 days.

