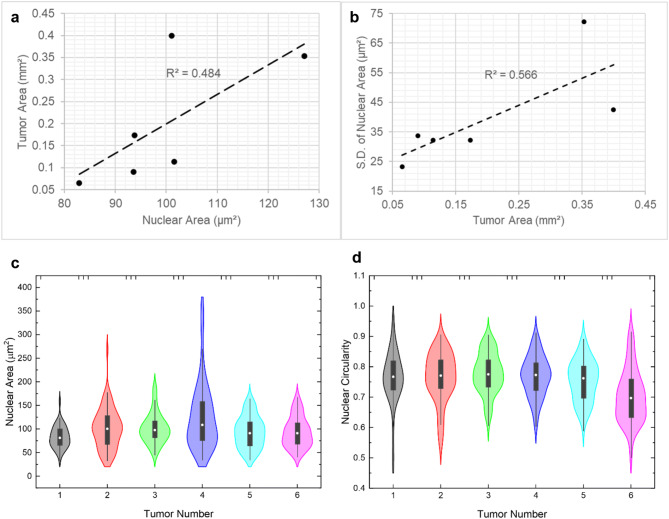
Figure 4.
Morphometry analysis reveals a positive correlation between tumor area and high average as well as heterogeneity in nuclear area. Single MCF7 cells were cultured on collagen I islands, as described in Fig. 1. At day 14 of culture, area and circularity of tumors and areas of nuclei were analyzed with ImageJ. Trendline and associated R-square for the fit are shown with high positive Pearson correlation (r ≥ 0.70, n = 6) between nuclear area and tumor area (a) and between tumor area and standard deviation [S.D.] in nuclear area (used as a measure of heterogeneity) (b). c and d Violin plots of nuclear area and circularity for each of the six tumors where 50–75 nuclei were analyzed per tumor.

