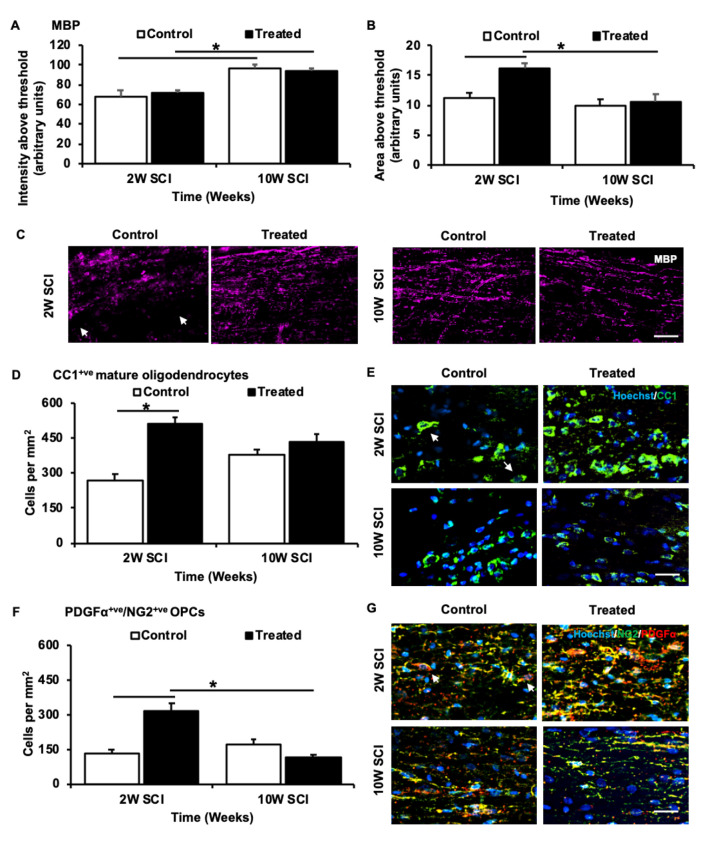
Figure 6.
Effects of Lom, oxATP, and YM872 on myelin basic protein (MBP) and oligodendroglia sub-populations, at 2W and 10W post-SCI. (A) Mean ± SEM intensity above the threshold, and (B) mean ± SEM area above the threshold of MBP (n = 6–7; *p ≤ 0.05). (C) Representative images show areas of MBP+ve (magenta) immunoreactivity surrounding the injury site. White arrows demonstrate large area regions where MBP was not detected (scale = 50 μm). (D) Mean ± SEM mature oligodendrocytes cells per mm 2 (n = 6–7; *p ≤ 0.05). (E) Representative images show the density of CC1+ve NG2−ve mature oligodendrocytes (green; indicated by white arrows) surrounding the injury site (scale = 25 μm). (F) Mean ± SEM OPCs per mm2 (n = 6–7; *p ≤ 0.05). (G) Representative images show the density of NG2+ve/PDGFα+ve OPCs (green/red; indicated by white arrows) surrounding the injury site (scale = 25 μm; n = animal numbers).

