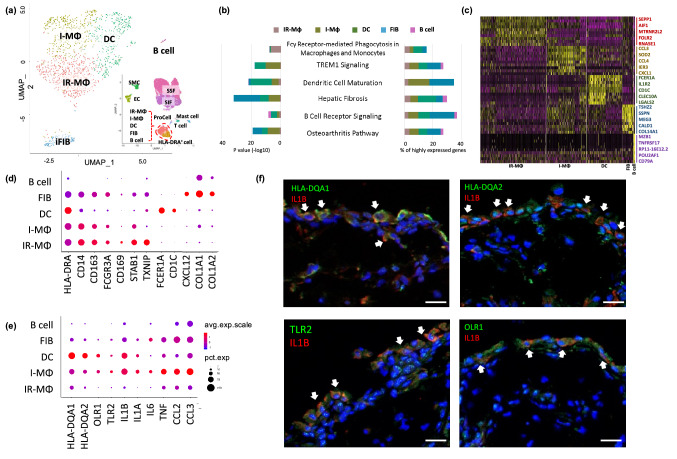
Figure 2.
Identification of specific HLA-DRA+ cell subtypes in OA synovia. (a) The HLA-DRA+ cell populations consisting of five distinct cell subtypes are shown in a UMAP plot. (b) Bar graphs demonstrate the top ranked canonical pathways associated with each cell subtype based on their percentage of highly expressed genes (right) and their significance (left). Pathways related to these cells include: Fcγ receptor-mediated phagocytosis; TREM1 signaling; dendritic cell maturation; hepatic fibrosis; B cell receptor signaling; and multiple cell populations associated with OA. (c) Heatmap shows the top ten highly expressed genes for each cluster with the top five highly expressed genes per cluster highlighted on the right. The top highly expressed genes in IR-MΦ were SEPP1 and FLOR2 that are known to play a role in macrophage polarization and specifically expressed in regulatory macrophages, respectively. The top highly expressed genes in I-MΦ were inflammatory mediators, including CCL3 and CCL4. The top highly expressed genes in iFIB were collagen genes including COL14A1 and COL1A1. Consistent with identification as B cells were cells with high expression of MZB1, TNFRSF17 and CD79A. (d, e) The dot plots depict the average expression level (color scale) and percentage of cells expressing the selected marker genes (dot size) for each cluster. (d) The dot plot shows expression of HLA-DRA in all five cell subtypes and co-expression with an additional 11 markers (d) and additional immune markers and cytokines (e). (d) Classic macrophage marker genes (CD14, CD163 and FCGR3A) were highly expressed in IR-MΦ, I-MΦ and iFIB. Immune regulatory genes, CD169, STAB1 and TXNIP, were highly expressed in IR-MΦ. DC marker genes, FCER1A and CD1C were exclusively expressed in DC. Fibrous matrix genes (COL1A1 and COL1A2) and stromal cell-derived factor 1 (CXCL12) were highly expressed in iFIB. (e) Surface maker genes (HLA-DQA1, HLA-DQA2, OLR1 and TLR2) and cytokines were highly expressed in I-MΦ and DC. (f) Representative immunofluorescence staining showing co-expression of IL1B and surface biomarkers of I-MΦ and DC, such as HLA-DQA1, HLA-DQA2, OLR1 and TLR2 in human OA synovium. Scale bar = 20 μm.

