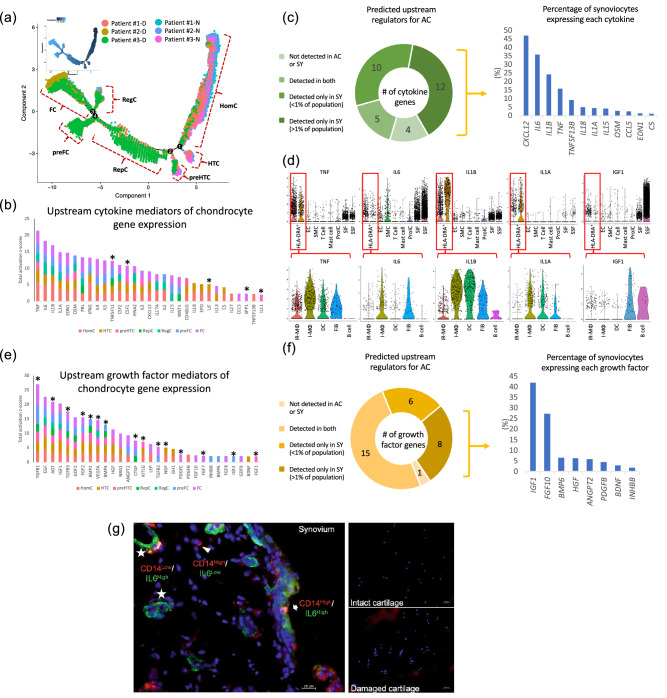
Figure 3.
Identification of chondrocyte cell types in OA and the potential upstream regulators of these phenotypes. a shows a similarity across patients and a predominance of preFibrochondrocytes (preFC), Fibrochondrocytes (FC), Regulatory chondrocytes (RegC), Reparative chondrocytes (RepC) and some preHypertrophic chondrocytes (preHTC) in diseased areas designated ‘D’ corresponding to the medial tibial plateau (MT); a also shows a predominance of Homeostatic chondrocytes (HomC), some PreHTC and Hypertrophic chondrocytes (HTC) in non-diseased areas designated ‘N’ corresponding to OLT or the lateral tibial plateau. Potential upstream cytokines (b) and growth factors (e) were identified based on all highly expressed genes from each cluster and scaled by activation z-score; asterisks indicate the upstream mediators that were expressed by > 1% of acquired chondrocytes. Nearly all cytokines (c) and growth factors (f) were expressed by synoviocytes: 22 of 31 cytokines and 14 of 30 growth factors were only expressed by synoviocytes and not by chondrocytes (the proportion of acquired synoviocytes expressing each cytokine and growth factor are shown in the pie charts). (d) Violin plots show expression levels of representative cytokines (TNF, IL6, IL1B and IL1A) and a growth factor (IGF1) across all cell types in OA synovia and the HLA-DRA+ cell subtypes. (g) Representative immunofluorescence staining of synovium and cartilage (intact and damaged regions of a single patient specimen) for IL6 and CD14. As expected, the damaged cartilage is hypercellular compared to intact cartilage due to the development of multicellular chondrons in damaged cartilage with osteoarthritis. IL6 was highly expressed by CD14+ synovial fibroblasts (SSF, SSF and iFIB), I- MΦ, and SMC, but not chondrocytes from either intact or damaged regions of cartilage.

