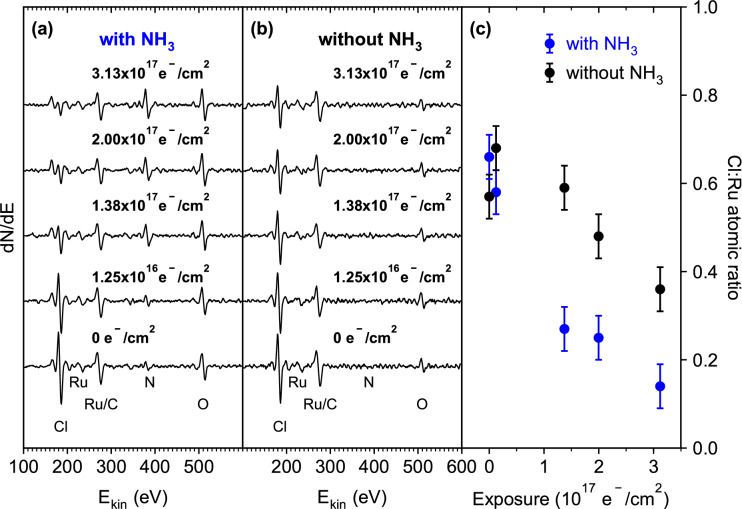
Figure 6.
Auger electron spectra (AES) recorded on a deposit prepared by electron exposure (1.25·1017 e−/cm2) at E0 = 31 eV and subsequent annealing to 450 K of an adsorbed layer of (η3-C3H5)Ru(CO)3Cl on Ta before (bottom) and after an increasing number of purification cycles (from bottom to top) (a) in the presence of NH3 and (b) without NH3. Each purification cycle comprised an electron exposure of 1.25·1016 e−/cm2 followed by annealing to 450 K. (c) Relative amounts of Cl and Ru after increasing numbers of purification cycles performed on the deposit in presence of NH3 (blue) and on the deposit only (black). These values were determined from the peak-to-peak intensities of the Cl signal at 184 eV and the Ru signal at 235 eV by accounting for the respective sensitivity factors for 5 keV impinging electrons [0.6941 for Ru (235 eV) and 8.1285 for Cl (184 eV)28].

