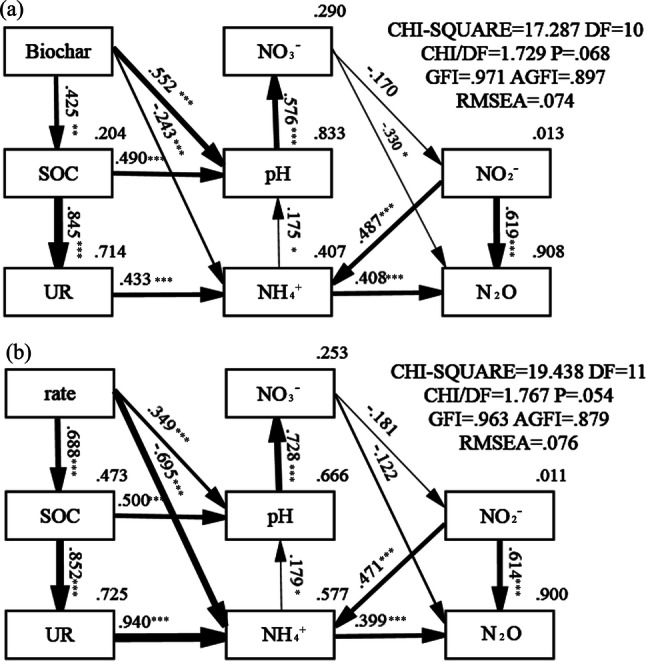
Figure 6.

Structural equation model (SEM) diagram showing the potential causal pathways of biochar type (a) and application rate (b) on soil properties and N2O emission. The thickness of arrow represents the strength of the relationship between variables. The values associated with arrows are standardized pathway coefficients, and positive or negative numbers indicating the positive or negative relationships. Values in top right corner of box (endogenous variables) indicate the fraction be explained by the model.
