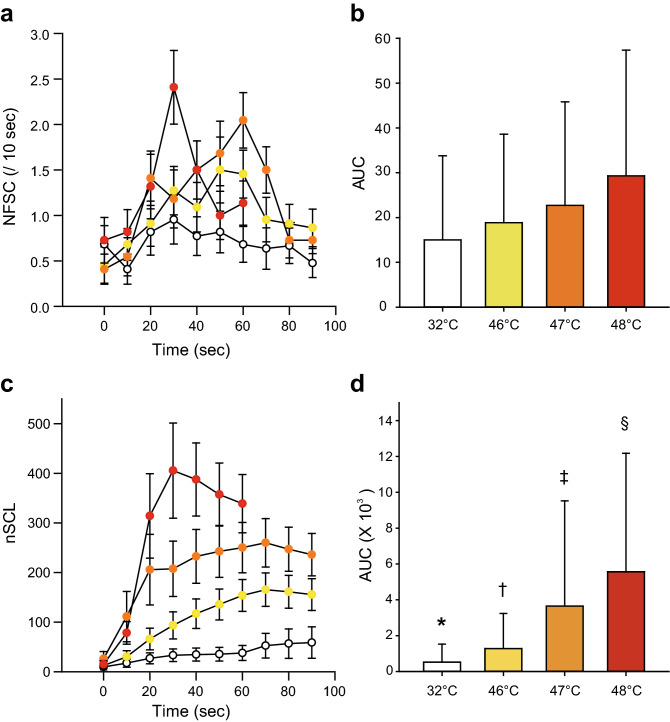
Figure 2.
Changes in skin conductance during the heat stimulus period. (a) Time course of NFSC during heat stimulation. The white, yellow, orange and red circles indicate NFSC values during control (32 °C), 46 °C, 47 °C and 48 °C heat stimulation. (b) Comparison of the area under the curve (AUC) of NFSC during heat stimulation with various temperatures indicated no significant differences between them. (c) Time course of nSCL during heat stimulation. nSCL reflected heat intensity well. (d) AUC of nSCL between the different temperatures used for heat stimulation. There were significant differences among all pairs of heat stimuli, including control (32 °C) stimulation. One-way ANOVA post hoc Student–Newman–Keuls test, P < 0.05, * 32 °C vs. all other stimuli, † 46 °C vs. all other stimuli, ‡ 47 °C vs. all other stimuli, § 48 °C vs. all other stimuli.

