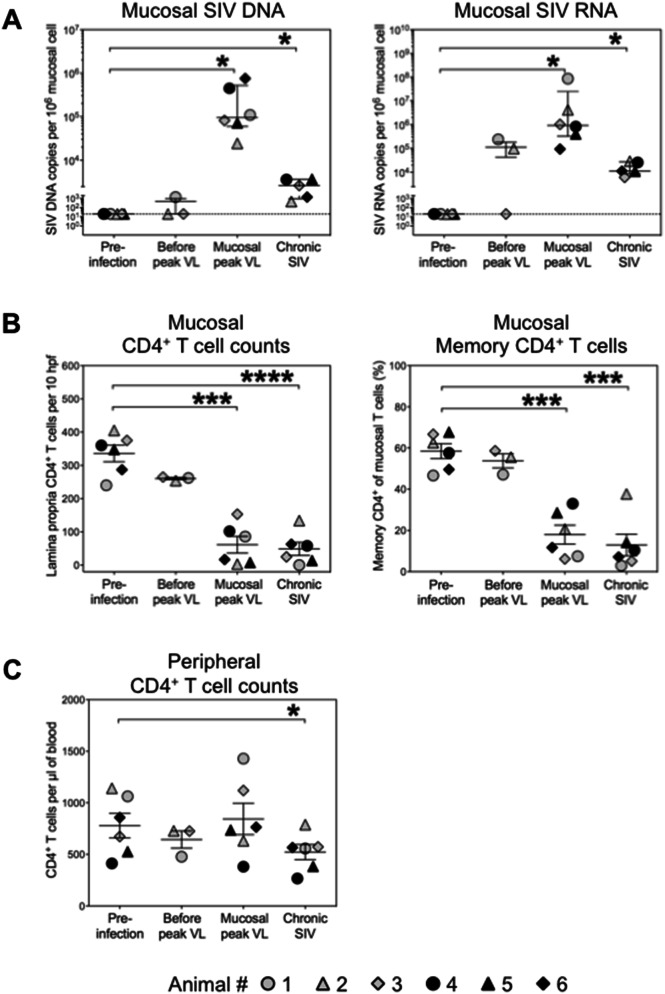
Figure 1.
Mucosal SIV copy numbers and CD4+ T cells in the colon of SIV-infected animals. (A) Cell-associated SIV DNA and RNA copies were quantified longitudinally in colonic tissue before and after i.v. infection with SIVmac251. (B) CD4+ T cells in the colonic lamina propria were quantified by immunohistochemical analysis and the proportion CD45RA- memory phenotype CD4+ cells within mucosal CD3+ T cells was determined by flow cytometry before and at different stages of SIV infection. (C) CD4+ T cell counts in the peripheral blood were measured in parallel. Mucosal peak viral load was observed on day 7 (black symbols) or on day 14 after infection (grey symbols). Day 7-samples of the three animals, in which mucosal viral load peaked on day 14, represent ‘before peak viral load’ data. Equivalent data samples were not available from animals in which mucosal viral load peaked already on day 7. The chronic phase was analyzed on day 49 after infection. Horizontal solid lines indicate mean values + /− standard deviations. The dashed horizontal line indicates the assay limit of detection. *P < 0.05, ***P < 0.001, ****P < 0.0001. VL viral load.

