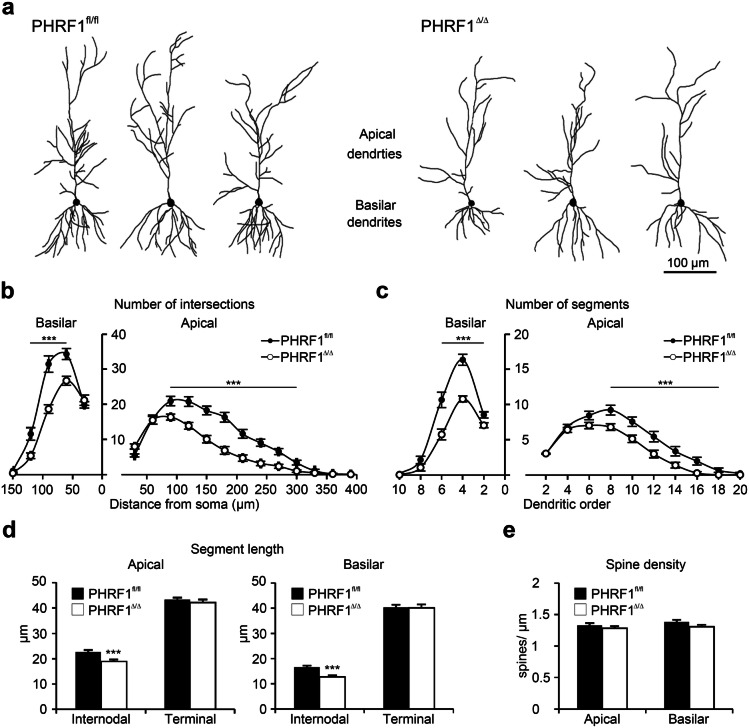
Figure 4.
Dendritic architectures of CA1 pyramidal neurons. (a) Examples of reconstructed CA1 pyramidal neurons from both genotypes. (b, c) Dendritic complexity was assessed by Sholl analysis and the number of segments of each dendritic order. (d) The length of internodal and terminal dendritic segments. (e) Density of dendritic spines. n≧30 neurons from 7 mice for each genotype. Data are mean ± SEM. *p < 0.05, **p < 0.01, ***p < 0.001, two-tailed unpaired Student t-test.

