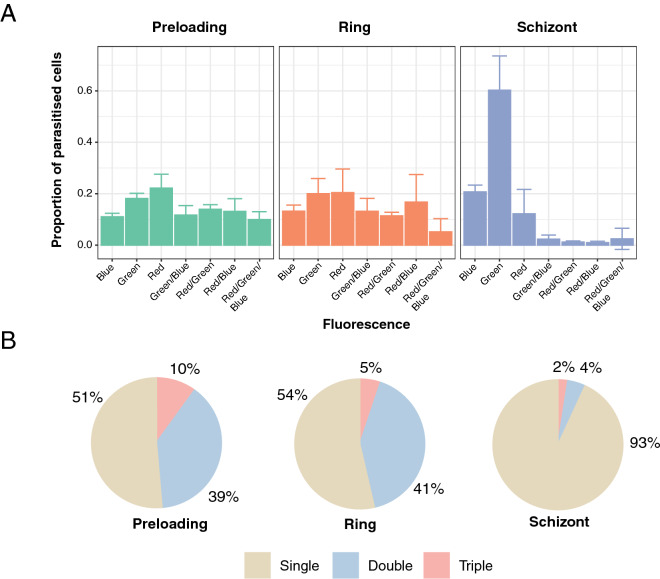
Figure 4.
Influence of the method of transfection on plasmid uptake. (A) Shows proportions of each population of fluorophore-expressing parasites for each method of transfection as measured by flow cytometry. Error bars represent standard deviations derived from two to three biological replicates (see “Methods” section). (B) Shows the proportion of each population of parasites expressing either single, double or triple combination of fluorophores for each method of transfection. Values were rounded to the nearest percent.

