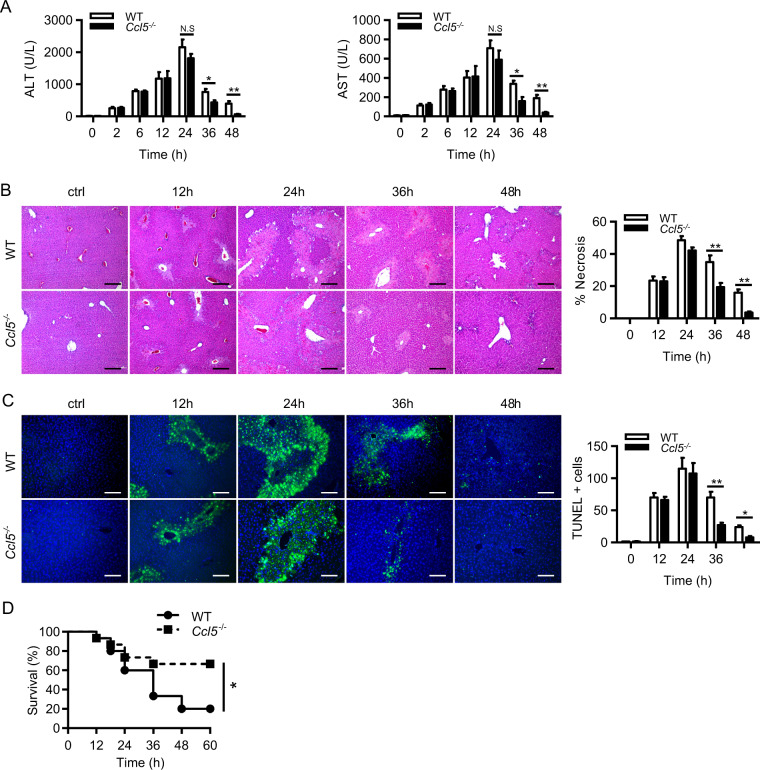
Fig. 2.
Ccl5−/− mice display rapid liver recovery after APAP treatment. a–c APAP treatment in both Ccl5−/− and WT mice at the indicated time points (n = 4–6). a Serum levels of ALT/AST of both genotypes. b Representative images of H&E staining (original magnification = ×100, scale bar = 200 μm) and the statistical quantification of hepatic necrosis. c Representative images of TUNEL staining (original magnification = ×200, scale bar = 100 μm) and the statistical quantification of TUNEL-positive cells. d Survival curve of Ccl5−/− and WT mice in response to a lethal dose of APAP (n = 15). The data are shown as means ± SEM, *P < 0.05, **P < 0.01

