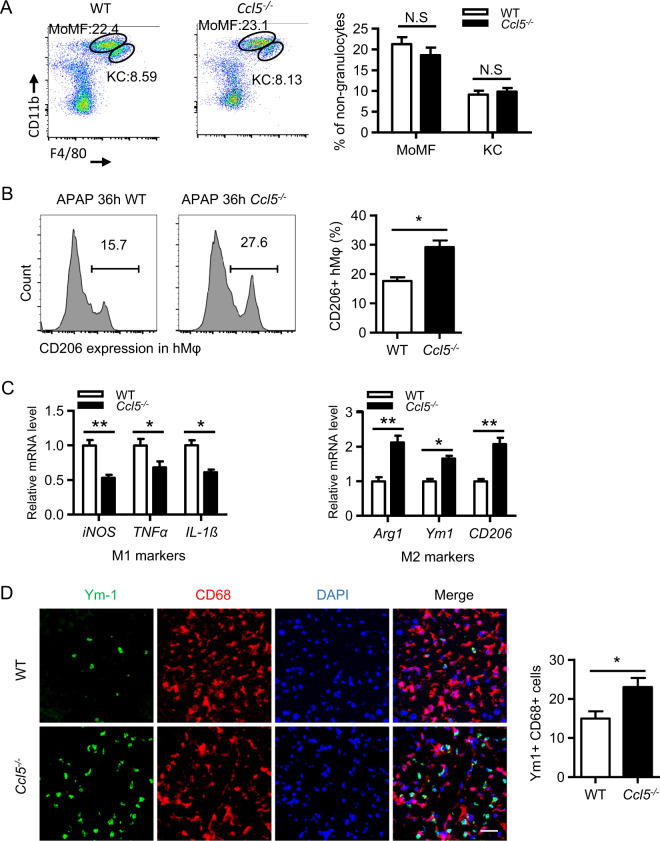
Fig. 4.
Increased M2 macrophages in Ccl5−/− mice at the late phase of APAP treatment. a–d APAP treatment in both Ccl5−/− and WT mice at 36 h. a Representative MoMF (CD11bhighF4/80int) and KC (CD11bint F4/80high) profiles of CD45+ liver nongranulocytes from Ccl5−/− and WT mice 36 h after APAP treatment and the quantification of the proportion of MoMFs and KCs relative to total CD45+ liver nongranulocytes (n = 4–6). b Representative FACS plots and the statistical quantification of CD206+ hepatic macrophages (hMφ) (n = 4–6). c The relative expression of M1 markers (iNOS, IL-1β, and TNFα) and M2 markers (Arg1, Ym1, and CD206) was determined in FACS-sorted hepatic macrophages (CD45+CD11b+F4/80+) (n = 4). d Representative images and the statistical quantification of hepatic cells positive for CD68 (a panmacrophage marker) and Ym1 (an M2 macrophage marker) in liver sections (original magnification = ×400, scale bar = 50 μm). The data are shown as the means ± SEM, *P < 0.05, **P < 0.01. hMφ hepatic macrophages

