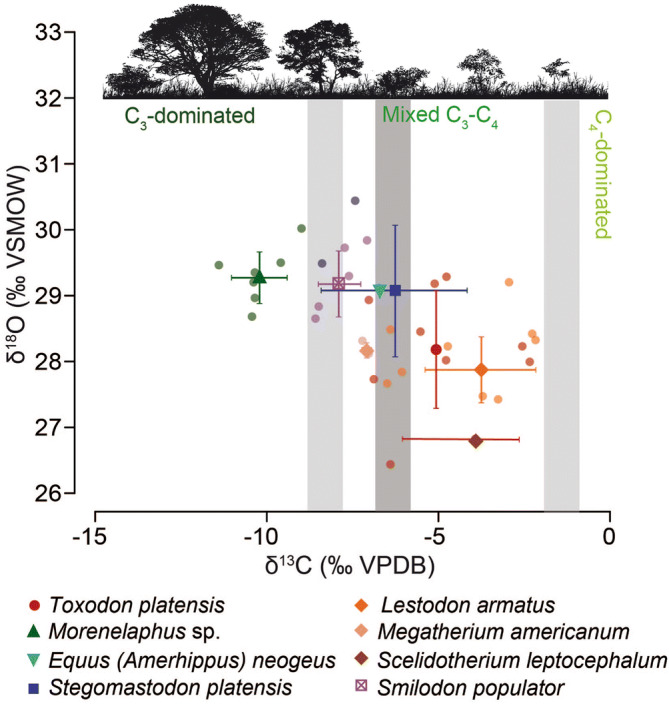
Figure 6.

Raw and mean (± 1 standard deviation) δ13C (‰, VPDB) and δ18O (‰, VSMOW) values for different mammals from Playa del Barco site. The grey bars represent the vegetation δ13C cut-off values between a C3-dominated diet, a mixed C3-C4 diet, and a C4-dominated diet. The lightest grey denotes a δ13C bioapatite-diet enrichment of + 14.1‰ (according to Cerling and Harris55 values), whereas the darkest one corresponds to an enrichment of + 15.6‰ for xenarthrans (according to Tejada-Lara et al.56 values).
