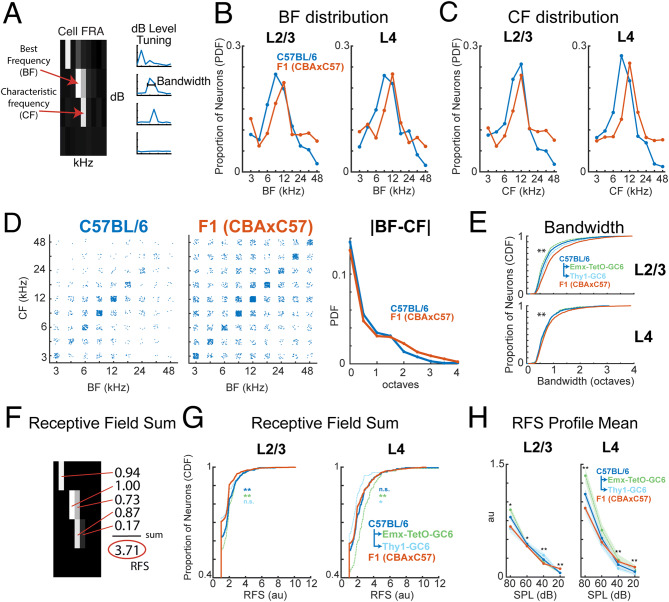
Figure 2.
Larger bandwidth and more sensitive hearing in F1 (CBAxC57) mice. (A) Example FRA illustrating the measurement and computation of BF, CF, and bandwidth. (B) Histograms of BF distributions for C57BL/6 (blue) and F1 (CBAxC57) (orange) mouse strains in both L2/3 (left) and L4 (right). (C) Conventions as in (B), but for CF. (D) BF plotted against CF for each neuron in both mouse strains. Each dot represents an individual neuron. |BF–CF| shows the absolute magnitude of difference between BF and CF for each mouse strain. (E) Cumulative distribution functions of bandwidth in C57BL/6 (blue) and F1 (CBAxC57) (orange) mouse strains in both L2/3 (left) and L4 (right). C57BL/6 breakdown of GCaMP6s lines also displayed for Emx-TetO-GC6 (green) and Thy-GC6 (light blue). ** Indicates significance between C57BL/6 and F1 (CBAxC57) at p < 0.01 (Wilcoxon rank sum test). (F) Example calculation of Receptive Field Sum. (G) Cumulative distribution functions of receptive field sum values in C57BL/6 (blue) and F1 (CBAxC57) (orange) mouse strains in both L2/3 (left) and L4 (right). Median and IQR for each distribution: C57L2/3 = 1.00 (0.83), F1L2/3 = 1.00 (0.66), C57L4 = 1.00 (1.18), F1L4 = 1.00 (0.92). (H) Receptive field sum split up by sound level. Sum is taken across rows in (F) and then averaged across all neurons. * and ** Indicates significance between C57BL/6 and F1 (CBAxC57) at p < 0.05 and p < 0.01 respectively (Wilcoxon rank sum test). Further statistical test details are included in Supplementary Table S1.

