Figure 3.
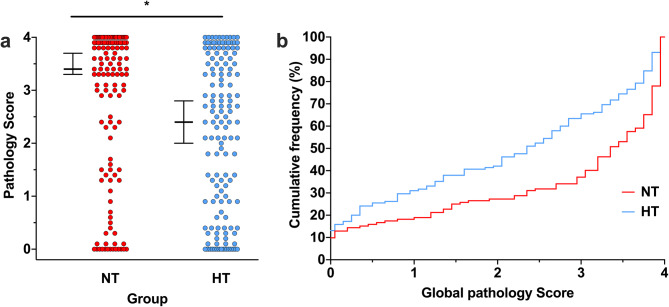
Global pathology scoring. (a) In the subset of animals that underwent formal pathology scoring (n = 277; n = 132 NT, n = 145 HT), median (95% CI) global pathology score 3.4 (3.3–3.7) in the NT group, and 2.4 (2.0–2.8) in the HT group. *Denotes significant neuroprotection (p < 0.001). (b) Cumulative frequency plot from the NT (n = 132) and HT (n = 145) groups, with each observation resulting in a proportional increase in the y-axis. A relatively uniform degree of neuroprotection is seen across the whole range of injury severity, with increasing relative neuroprotection in the HT group up to a global pathology score of 3.0.

