Figure 4.
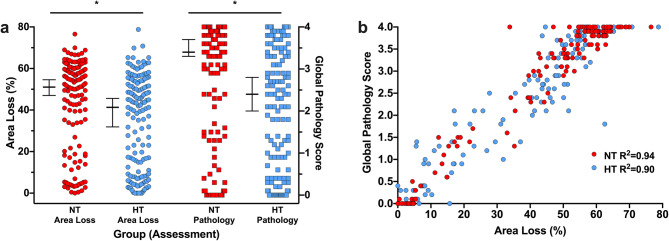
Comparison between area loss and global pathology score. (a) Direct comparison of area loss and pathology score in the n = 277 (n = 132 NT, n = 145 HT) animals that underwent pathology scoring, representing the median injury in the NT and HT groups within each litter from each experiment. Median (95% CI) area loss was 51.0% (47.0–54.6%) in the NT group, and 41.3% (31.6–45.6%) in the HT group, with corresponding global pathology scores of 3.4 (3.3–3.7) in the NT group, and 2.4 (2.0–2.8) in the HT group. This resulted in a 19.0% neuroprotection by HT, compared to 25% neuroprotection when comparing the same animals using global pathology score. The resulting ES for HT was 0.42 when using area loss, and 0.51 when using global pathology. (b) Global pathology score was linearly correlated with area loss in both the NT (R2 = 0.94, p < 0.001) and HT (R2 = 0.90) groups (p < 0.001 for both).

