Figure 5.
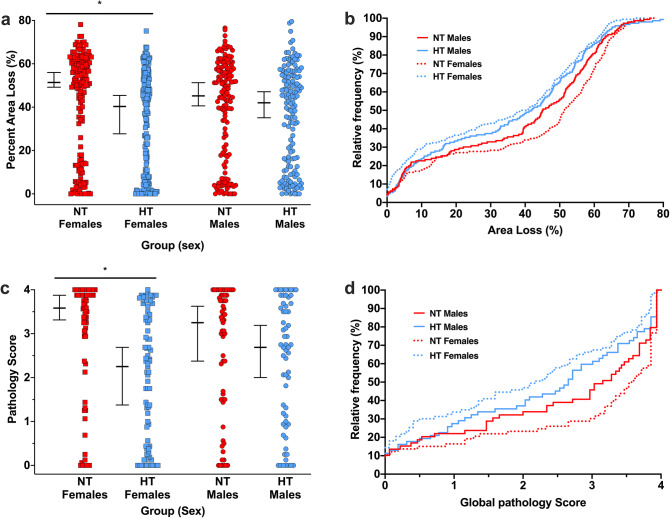
Sex effects of hypothermic neuroprotection. (a) Median (95% CI) area loss in the NT group was 51.4% (49.2–56.0%; n = 159) in females, and males 45.2% (40.6–51.3%; n = 146) in males. In the HT group, median area loss was 40.3% (27.7–45.4%; n = 170) in females, and 42.0% (35.1–47.1%; n = 147) in males. The median differences between the NT and HT groups were 11.1% (21.6% neuroprotection) in females, and 3.2% (7.1% neuroprotection) in males. (b) Cumulative frequency distribution plot of area loss. (c) Median (95% CI) global pathology score in females was 3.6 (3.3–3.9, n = 73) in the NT group, and 2.3 (1.4–2.7, n = 83) in the HT group. In males, median global pathology score was 3.3 (2.4–3.6, n = 59) in the NT group, and 2.7 (2.0–3.2, n = 62) in the HT group. (d) Cumulative frequency global pathology score. The cumulative frequency plots suggest HT is neuroprotective across the entire range of injury in females, with neuroprotection in males centred solely around moderate injury scores (~ 20–55% area loss). *Denotes significant neuroprotection (p < 0.001).

