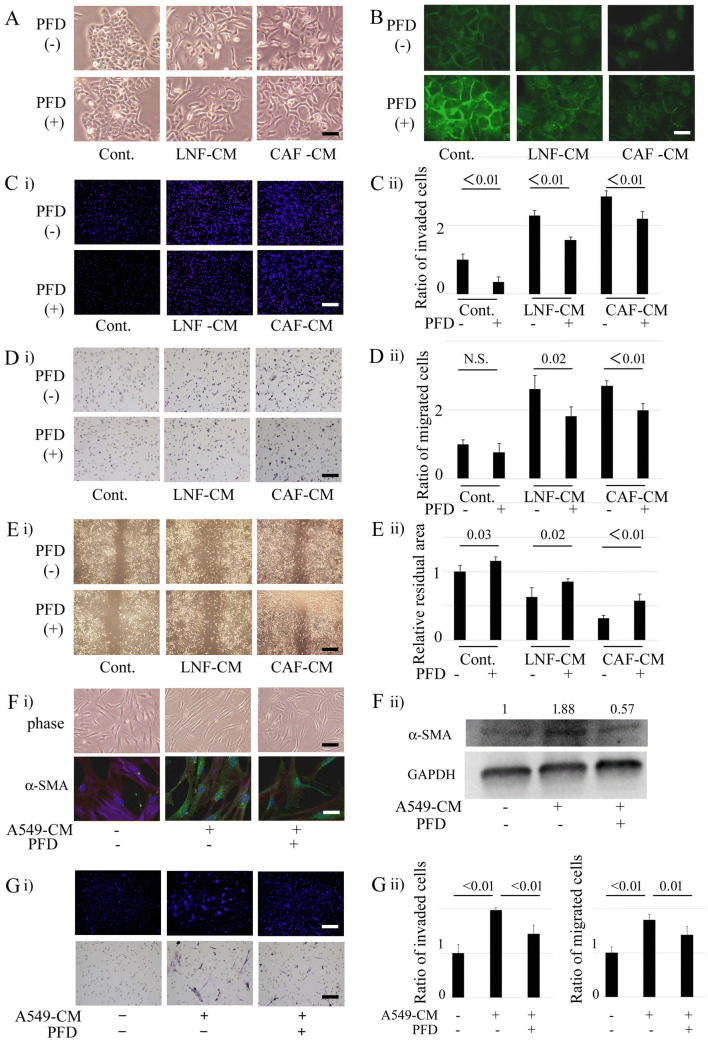
Figure 2.
Inhibitory effects of pirfenidone on the interaction between primary cultured fibroblasts and non-small cell lung cancer cells. (A) A549 cells are cultured with conditioned medium (CM) from cancer-associated fibroblasts (CAFs) or lung normal fibroblasts (LNFs) for 2 days and compared to the A549 cells cultured with normal DMEM. In the process of CM preparation, CAFs or LNFs are cultured with or without pirfenidone (PFD) for 24 h, and then PFD is removed. Phase contrast pictures were taken. Scale bar: 100 µm. (B) A549 cells are treated as in A, and the cells are then immunofluorescently stained with E-cadherin. Scale bar: 50 µm. (C) Invasion assays are performed, and cells traversing the filter counted. DMSO, PFD (500 µg/mL), LNF-CM, or CAF-CM with or without PFD pretreatment is added to the lower side of the chamber. Panel (i) shows representative findings. Scale bar: 200 µm. Panel (ii) shows the ratio of invaded cells compared to control. All experiments were performed three times independently, and columns represent the means ± SD. (D) Motility assays are performed, and cells traversing the filter counted. DMSO, PFD (500 µg/mL), LNF-CM, or CAF-CM with or without PFD pretreatment is added to the lower side of the chamber. Panel (i) shows representative findings. Scale bar: 130 µm. Panel (ii) shows the ratio of invaded cells compared to control. All experiments were performed three times independently, and the columns represent the means ± SD. (E) Wound healing assays are performed, and the remaining area that escaped from cell migration is measured. DMSO, PFD (500 µg/mL), LNF-CM, or CAF-CM with or without PFD pretreatment is added after scratching. Panel (i) shows representative findings. Scale bar: 400 µm. Panel (ii) shows the ratio of invaded cells compared to control. All experiments were performed three times independently, and columns represent the means ± SD. (F) CAFs are cultured with CM from A549 cells for 2 days and compared to control. In the process of CM preparation, A549 cells are cultured with or without PFD for 24 h, and then PFD is removed. Panel (i) upper part: phase contrast pictures. Scale bar: 200 µm. lower part: immunofluorescence staining for α-SMA. Scale bar: 50 µm. Panel (ii) Treated CAFs are analyzed by Western blotting for α-SMA and GAPDH (loading control). Experiments were performed two times independently. Data shown are representative experiments and their quantitative values. (G) Invasion and motility assays of CAFs are performed, and cells traversing the filter counted. DMSO or A549-CM with or without PFD pretreatment is added to the lower side of the chamber. Panel (i) upper part: representative findings of invasion assays. Scale bar: 200 µm. lower part: representative findings of motility assays. Scale bar: 200 µm. Panel (ii) left part: the ratio of invaded cells compared to control. right part: the ratio of migrated cells compared to control. All experiments were performed three times independently, and the columns represent the means ± SD.

