Figure 3.
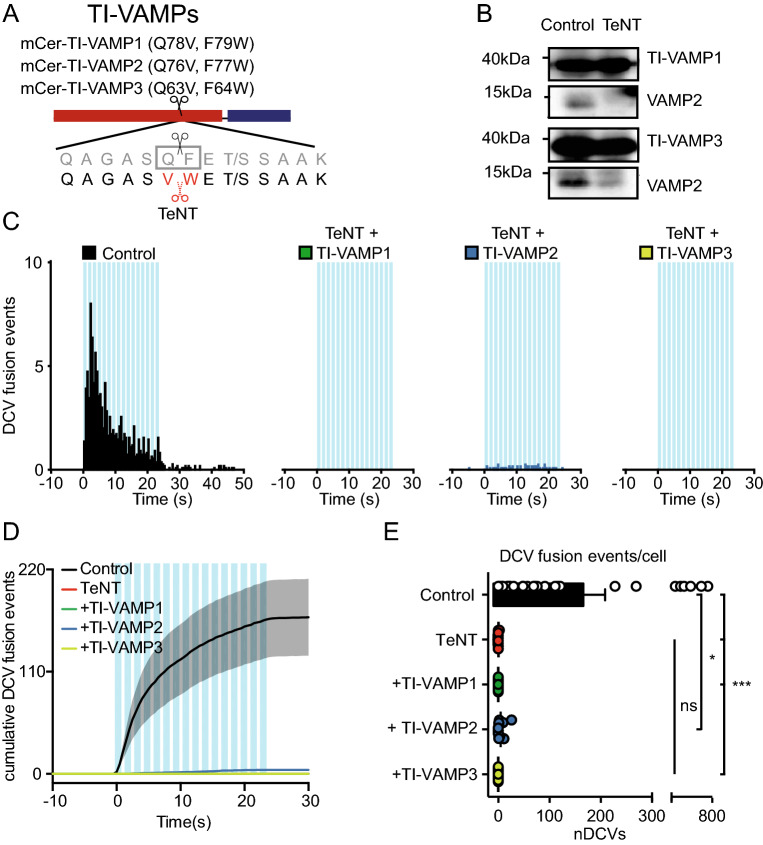
TI-VAMP1, TI-VAMP2 and TI-VAMP3 do not rescue DCV fusion in TeNT treated neurons. (A) Schematic representation of TI-VAMPs. Q78V, F79W (VAMP1), Q76V, F77W (VAMP2), Q63V, F64W (VAMP3) substitutions interfere with TeNT cleavage. N-terminal mCerulean (mCer) allows detection of the construct in live imaging experiments. (B) Western blot of neuronal lysate (DIV 16) infected with TI-VAMP1 or TI-VAMP3 (DIV 2), and control construct or TeNT (DIV 14), incubated with antibody against VAMP1, VAMP2 and VAMP3 (original blots are shown in Figure S4). (C) Histogram of DCV fusion events per cell in control, TeNT + TI-VAMP1, TeNT + TI-VAMP2, and TeNT + TI-VAMP3 infected neurons (infected with NPY-pHluorin at DIV 2, TI-VAMPs at DIV 0–4 and 8–9 and TeNT at DIV 8–9, imaged at DIV 14). Blue bars indicate 16 trains of 50 AP at 50 Hz interspaced by 0.5 s. (D) Cumulative plot of DCV fusion events of conditions as in C. Shaded area represents SEM. (E) Average DCV fusion events per cell for control (n = 27, N = 4), TeNT (n = 12, N = 4), TeNT + TI-VAMP1 (n = 11, N = 2), TeNT + TI-VAMP2 (n = 12, N = 2) and TeNT + TI-VAMP3 (n = 11, N = 2) infected neurons. Kruskal–Wallis with Dunn's correction: * p = 0.026, *** p < 0.0001, non-significant (ns) p > 0.05. Bars represent mean + SEM. Detailed statistics are shown in Supplementary Table S1.

