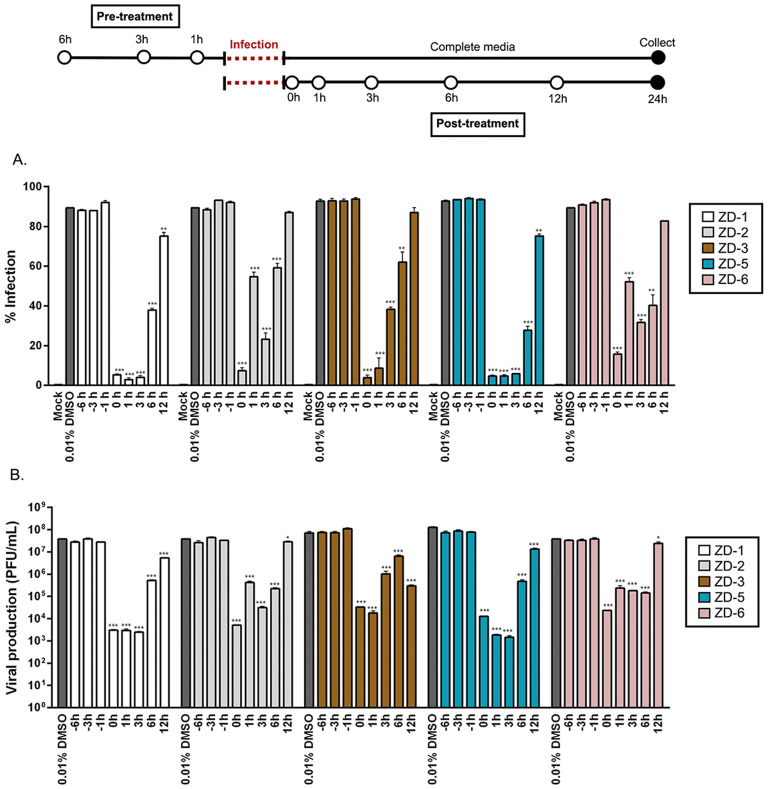
Figure 2.
Time-of-additional of VDR agonists. Mock or DENV infected HEK293T/17 cells were pre- and post-treated with 0.01% DMSO and 10 µM of ZD-1, ZD-2, ZD-3, ZD-5 and ZD-6 at various time points as shown in the diagram. (A) At 24 h.p.i. the treated cells were collected and the levels of infection determined using flow cytometry. (B) In parallel, the supernatant of the treated cells were evaluated for virus titer by standard plaque assay. p value; *< 0.05, **< 0.01, ***< 0.001 for significance. The experiment was performed independently in triplicate with duplicate plaque assay.

