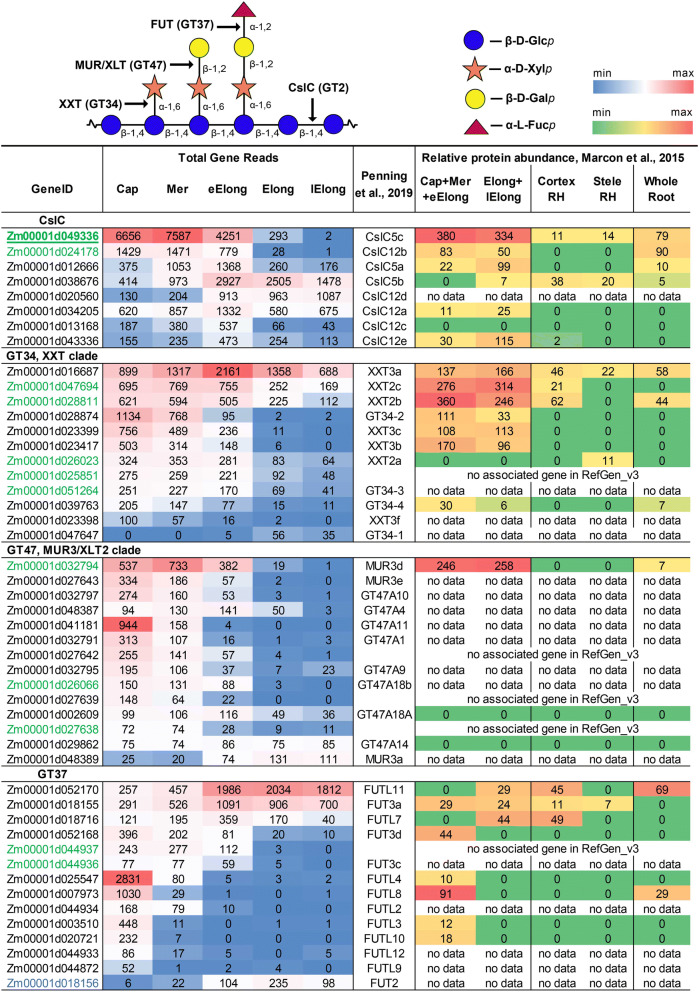
Figure 5.
Expression level (TGR, red-blue heat map) and relative protein abundance (averaged and normalized total spectral counts22, red-green heat map) of genes potentially involved in XyG synthesis in maize root. Heat map color coding is applied separately to each gene subgroup. The gene co-expressed with maize primary cell wall CesAs is labelled in blue. Green indicates genes co-expressed with ZmCslC5c (underlined) and displaying a correlation coefficient greater than 0.95. Annotations are based on the study by Penning et al.18, and are obtained by matching the RefGen_v3 and RefGen_v4 gene models. Cap—root cap, Mer—meristem, eElong—early elongation zone, Elong—zone of active elongation, lElong—zone of late elongation before root hair initiation, and RH—root hair zone. No data, i.e., no corresponding peptides, were detected in any of the studied root samples22.

