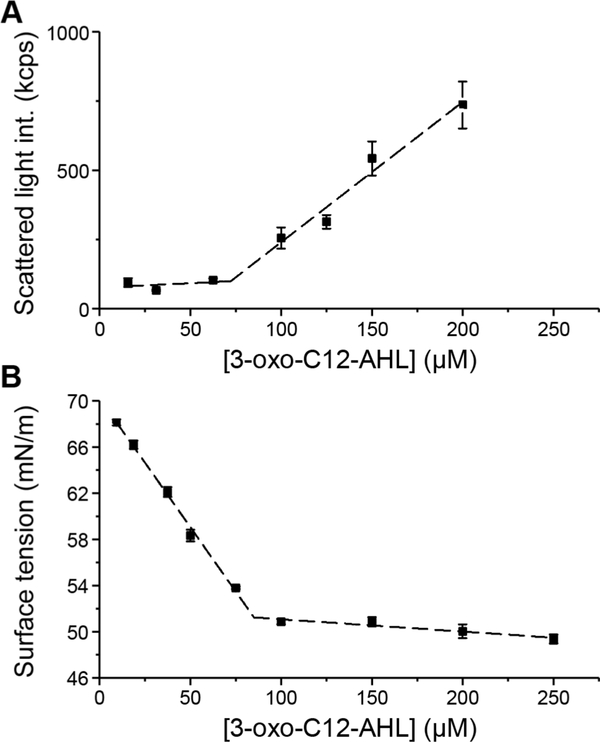
Figure 3:
Representative plots illustrating the calculation of the CAC for 3-oxo-C12-AHL using (A) light scattering at 30 °C, and (B) surface tension measurements. Error bars represent the standard deviation of three measurements for a single sample. The dashed lines represent the linear regression in (A) and (B). The CAC is calculated as the AHL concentration at which the two regression lines intersect. CACs reported in the main text (Table 1) are the average of three independent samples. Data for all samples are presented in the Supporting Information.

