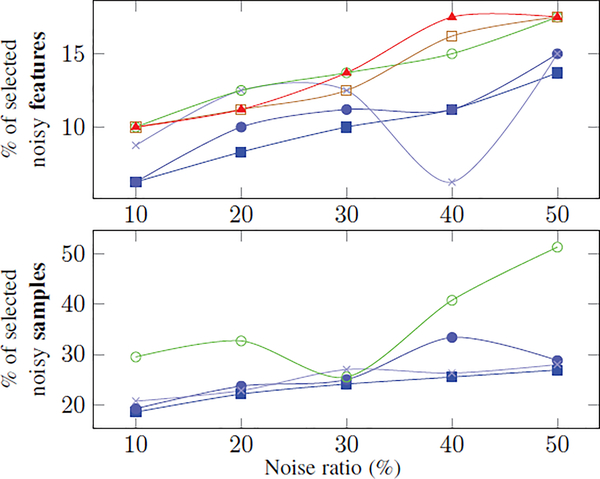
Fig. 6:
Percentage of the noisy features (top) and samples (bottom) that were selected during the 10-fold cross-validation by each method. The methods are marked according to the legend in Fig. 5. The bottom plot does not include -W and FSSVM-W methods as they omit sample selection. In general, proposed methods select less noisy features and samples than the alternatives.

